
FIGURE 2.
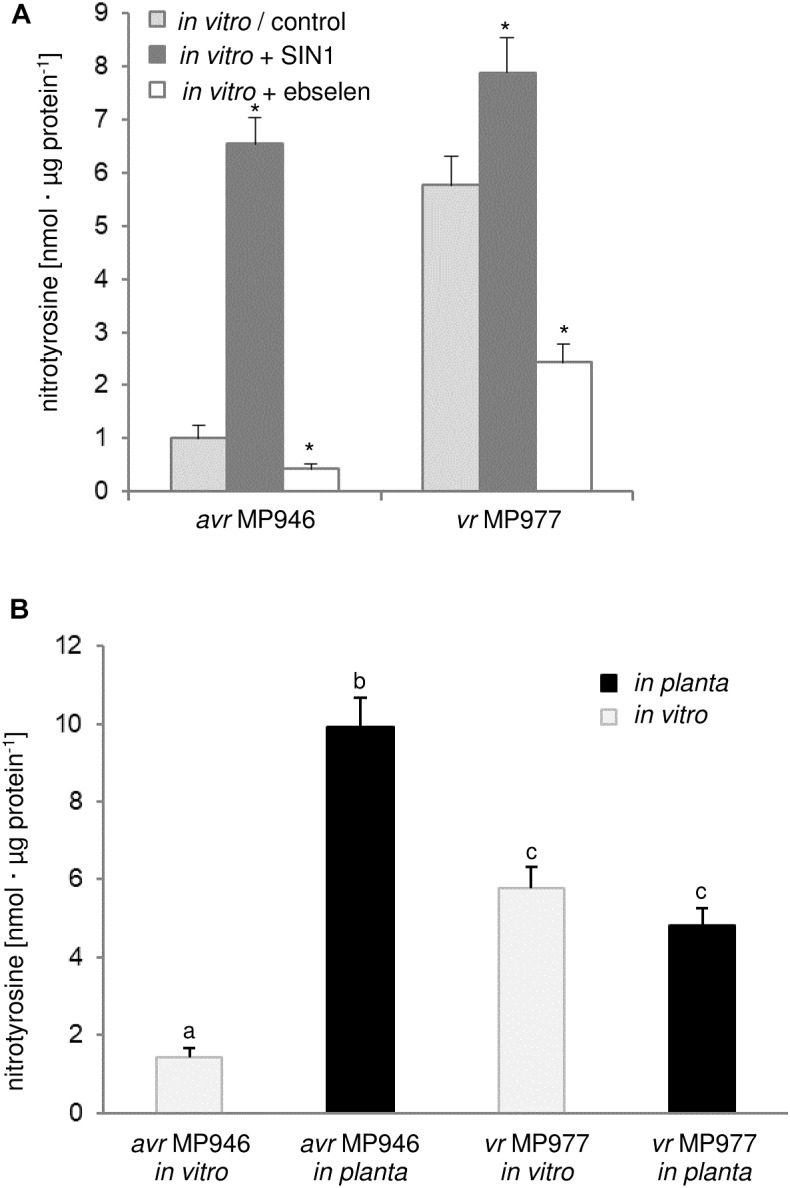
Quantification of protein Tyr nitration of avr MP 946 and vr MP 977 P. infestans. (A) Quantification of nitrated proteins measured as 3-nitrotyrosine content in avr MP 946 and vr MP 977 P. infestans structures enriched or depleted with ONOO- during in vitro growth; 3-nitrotyrosine content was estimated 5 h after P. infestans pretreatment with 50 μM SIN-1 or 50 μM ebselen; asterisks indicate values that differ significantly from the control (untreated) culture of avr MP 946 or vr MP 977 at ∗p < 0.05. (B) 3-nitrotyrosine content in avr MP 946 and vr MP 977 P. infestans growing under in vitro and in planta conditions; the results were calculated using the standard curve and expressed as nmol 3-nitrotyrosine/μg protein; values represent the mean ± SD of three biological replicates derived from three independent experiments (n = 9); columns marked with the same letter are not significantly different (Dunnett’s test) at p < 0.05.