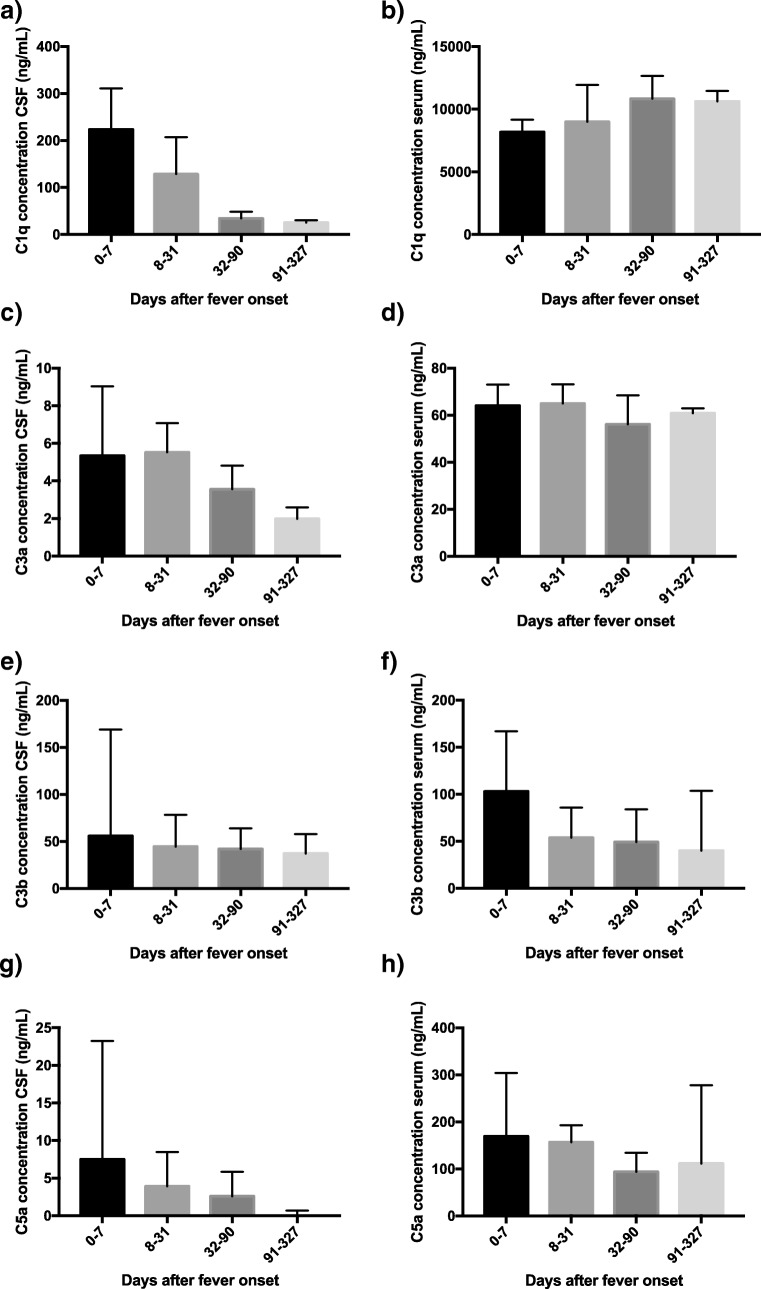
Fig. 3.
Box and whiskers plot of distributions of cerebrospinal fluid (CSF) and serum concentrations (ng/mL) of complement factors C1q, C3a, C3b, and C5a, measured with enzyme-linked immunosorbent assays (ELISAs), in TBE patients at different time points after the infection. Days 0–7: number of samples, n = 4, days 8–31: n = 24, days 32–90: n = 9, days 91–327: n = 7. Median concentrations are presented for each time period, with interquartile ranges indicated with error bars

