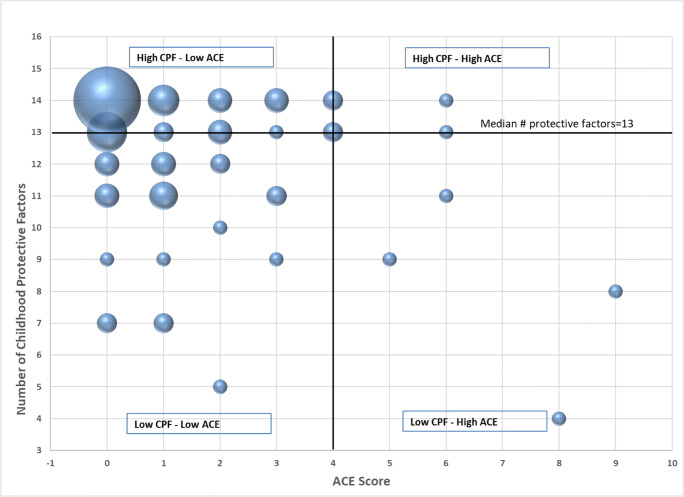
Fig. 1.
Bubble plot of ACEs and childhood protective factors for third-year medical students. The total number of ACEs is shown on the horizontal (X) axis, and the childhood protective factor score is shown on the vertical (Y) axis. The size of the X-Y data marker corresponds to the number of respondents with the corresponding ACE and protective factor score combination. Graphic was created in Microsoft Excel

