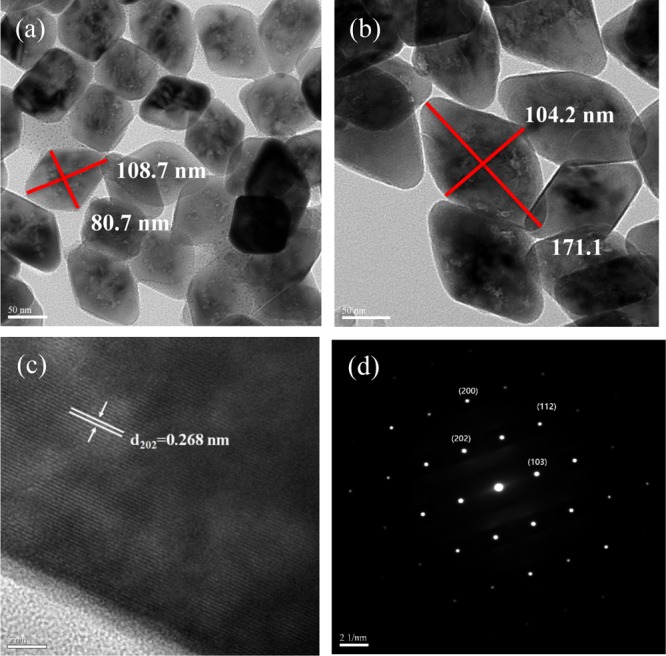
Figure 4.

HRTEM images (×500 K) of (a) LiYF4:Yb3+0.25,Tm3+0.01 core UCNP and (b) LiYF4:Yb3+0.25,Tm3+0.01@LiYF4:Yb3+0.2 core/shell UCNP. (c) HRTEM image (×300 K) of the single-crystalline structure of the LiYF4:Yb3+0.25,Tm3+0.01@LiYF4:Yb3+0.2 core/shell UCNP. (d) SAED pattern of the LiYF4:Yb3+0.25,Tm3+0.01@LiYF4:Yb3+0.2 core/shell UCNP.
