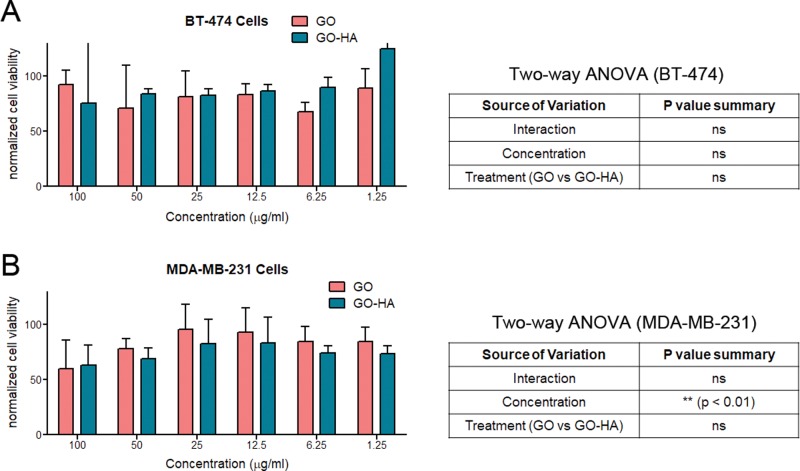
Figure 5.
Cytocompatibilities of nanoparticulates. Varying concentrations of particulates were cultured with (A) BT-474 and (B) MDA-MB-231, and their effect on cell viability was determined. Cell viability measurements are normalized to control cultures of cells in the absence of any particulates. Statistical testing was performed using two-way ANOVA, and the results are displayed in tables adjacent to the graphs.

