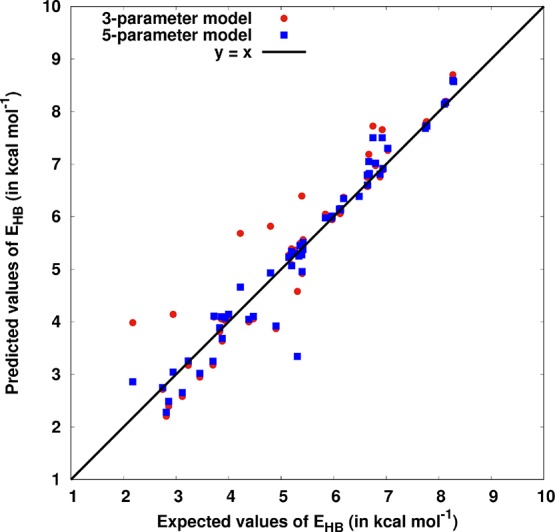
Figure 4.

Comparison of the three-parameter (in red circle) and five-parameter (in blue square) models for interbase H-bonds present in modified base pairs. The predicted values of EHB are plotted with respect to their corresponding expected values. To illustrate the performance of the two models, the y = x straight line is shown as a reference.
