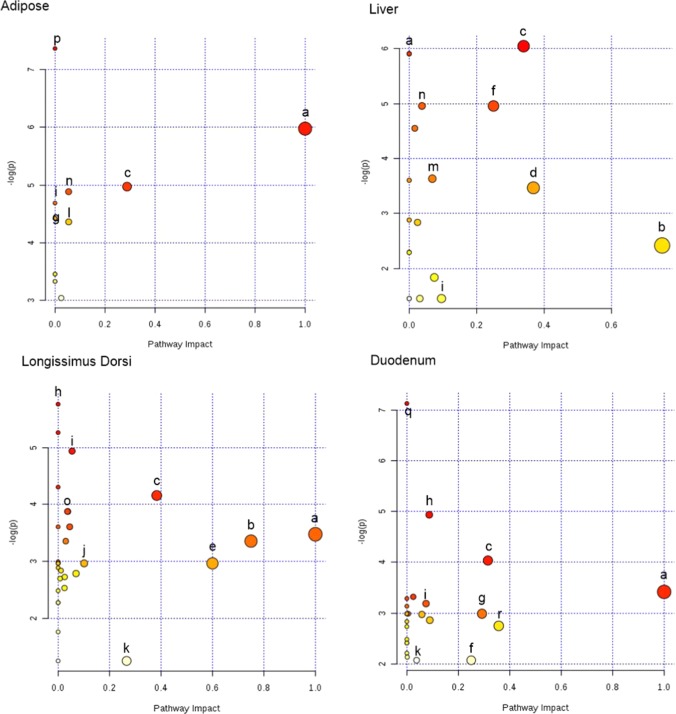
Figure 1.
Tissues metabolomics pathway analysis by MetaboAnalyst 3.0 Software on the steers with the greatest average daily gain compare to the least ADG with similar average dry matter intake according to Bos taurus KEGG pathway database. Ultra performance liquid chromatography quadrupole-time of-flight mass spectrometry (UPLC-q-Tof MS) metabolites identified to differ between ADG by t-test (p < 0.05). (a) α-Linolenic acid metabolism. (b) Taurine and hypotaurine metabolism. (c) Glycerophospholipids (GLP). (d) Glutathione metabolism. (e) Synthesis and degradation of ketone bodies. (f) Primary bile biosynthesis. (g) Glycine, serine, and threonine metabolism. (h) Histidine metabolism. (i) Gluconeogenesis/glucogenolisis metabolisms. (j) Purine metabolism. (k) Steroids metabolism. (l) Pyruvate metabolism. (m) Cholic acid biosynthesis. (n) Cysteine and methione metabolism. (o) Creatinine metabolism. (p) Unsaturated fatty acids. (q) Ether lipids metabolism. (r) Pentose and glucoronate interconversion. The darker the color and larger the size represent higher p-value from enrichment analysis and greater impact from the pathway topology analysis, respectively.

