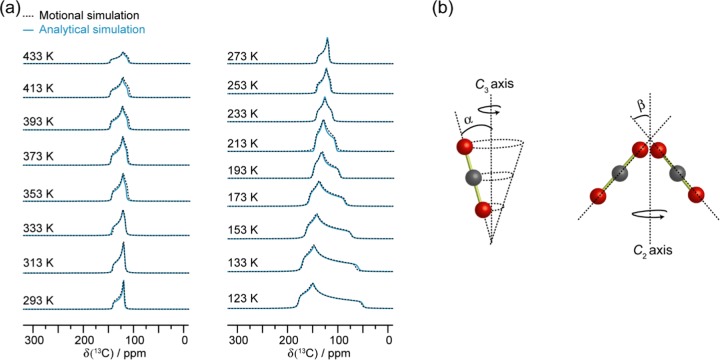
Figure 4.
(a) Motional simulations of the adsorbed CO2 resonance (dotted black trace), and the corresponding analytical simulation (solid blue trace) acquired by fitting the VT 13C SSNMR spectra (Figure 3). The motional simulations were constructed using a C3 rotation (b, left) and a C2 jump (b, right) for the CO2 dynamics. The angles α and β govern these two motions, and the corresponding values are provided in Table S10. Both motions occur at rates on the order of magnitude of ca. ≥107 Hz in the studied temperature range.

