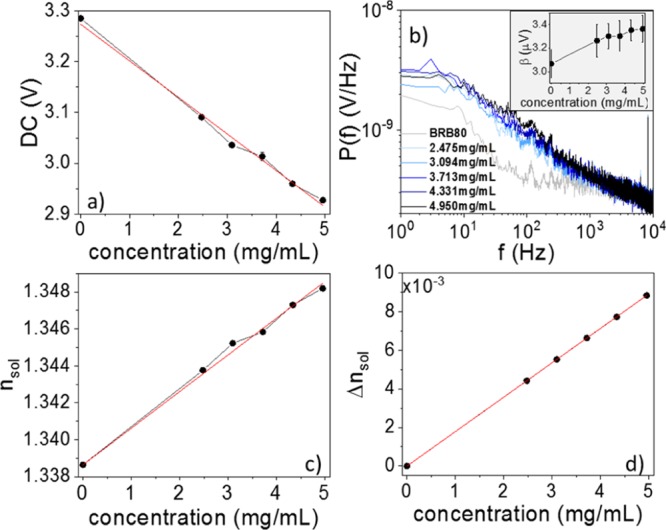
Figure 2.

(a) Reflectivity measured as the time-averaged signal recorded by the PD. (b) Averaged power spectra of the light intensity fluctuations recorded for different tubulin concentrations, as indicated. The inset shows the total scattered power β. (c) Effective RI of the tubulin suspension inferred from measured reflectivity in (a). (d) Glycerol-correction to the RI of tubulin suspension in (c); this must be subtracted before using EMTs to retrieve the polarizability of individual tubulin dimers.
