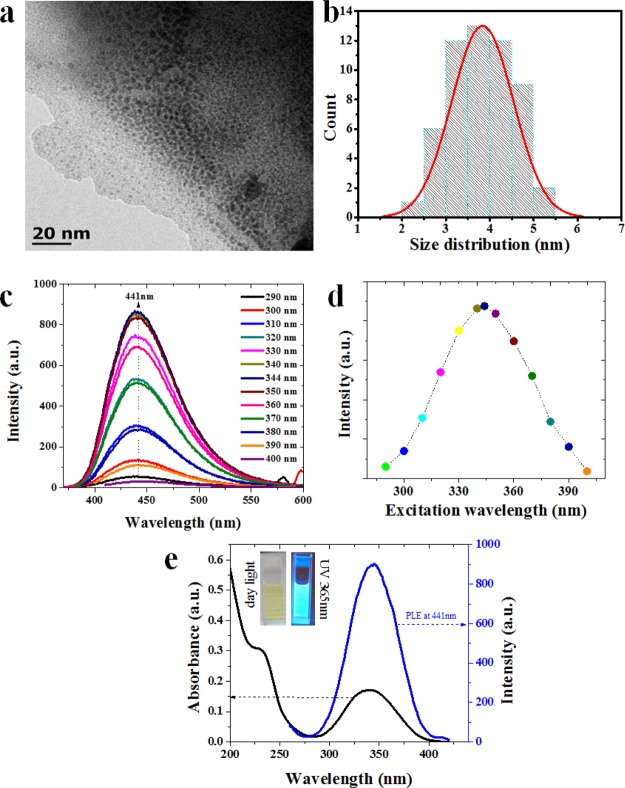
Figure 1.
(a) TEM image of as-prepared NGODs and (b) size distribution analysis from (a). (c) Fluorescence emission spectra of NGODs after excitation of 290–400 nm, (d) analysis of excitation wavelength vs intensity from PL spectra, and (e) UV–visible spectra and PLE spectra of NGODs at 441 nm. The inset shows NGODs illuminated under daylight and UV light 365 nm.

