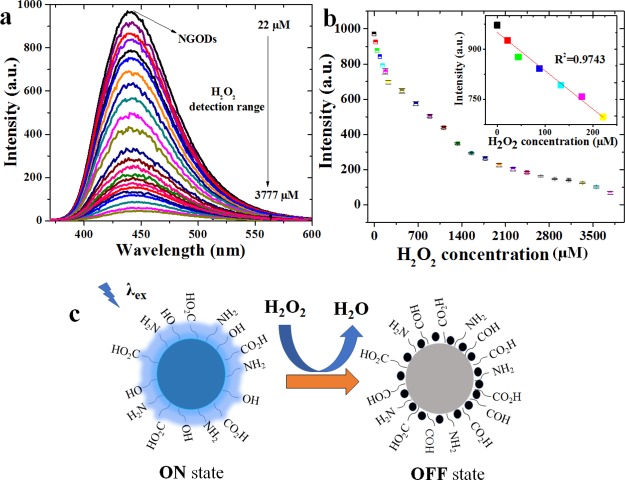
Figure 3.
PL quenching pattern of NGODs in deionized water with the presence of different concentrations of H2O2 (a) PL vs wavelength for λex = 344 nm, (b) PL peak intensity vs H2O2 concentration (the inset shows linear fit at low concentrations; R2 = 0.974), and (c) possible quenching mechanism due to H2O2 adsorption on NGODs, wherein the alcohol groups are oxidized to aldehyde groups.

