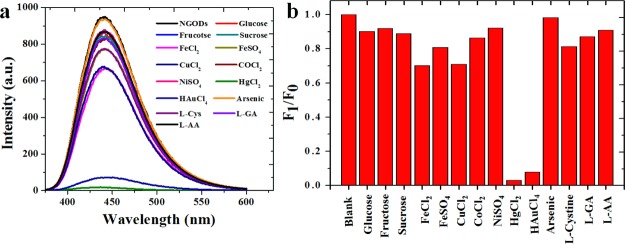
Figure 4.
Selectivity of Hg2+ and Au3+ using NGODs as probes using PL spectroscopy (a) PL intensity vs wavelength at λex = 344 nm for different metal ions at 250 μM concentration (except Au3+ at 300 μM) and (b) corresponding normalized graph at λem = 441 nm (F0 = NGOD PL intensity in deionized water and F1 = PL intensity with the metal ions). The selectivity was additionally checked with Ag+, Mn2+, Mg2+, and Zn2+ (ref to Figure S3).

