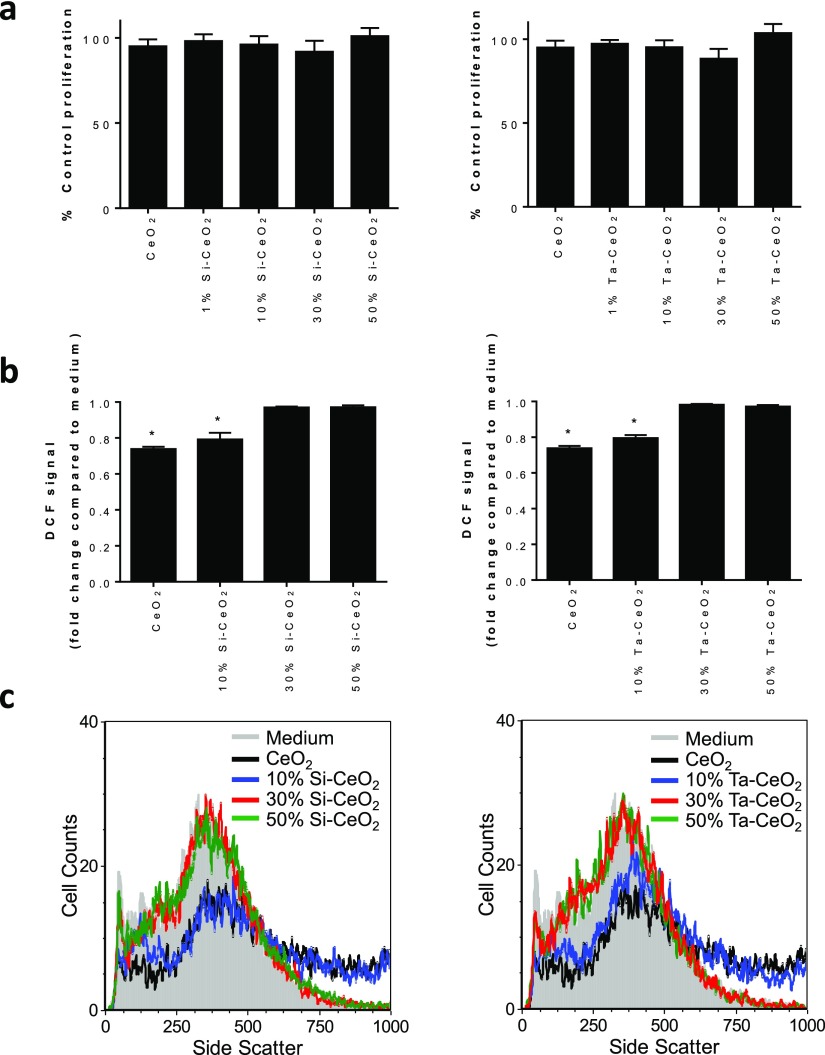
Figure 4.
(a) Viability of activated U937 cells exposed to 50 μg mL–1 nanoceria or doped nanoceria compared to cells exposed to medium-only (control proliferation) analyzed after 48 h. Data presented as mean ± standard deviation (SD, n = 3). Note that test conditions were found not to be statistically significant compared to cells exposed to medium-only, as analyzed by one-way analysis of variance (ANOVA) (p < 0.05). (b) Intracellular ROS levels in activated U937 cells as measured by DCF fluorescence by flow cytometry after 48 h of exposure to 50 μg mL–1 nanoceria or doped nanoceria. Data are presented as mean fold change in DCF compared to cells exposed to medium-only ±SD (n = 3) after correction for the level of DCF fluorescence in dead cells/cellular debris. CeO2, 10 at. % Si–CeO2, and 10 at. % Ta–CeO2 were found to significantly reduce intracellular ROS levels compared to cells exposed to medium-only (p < 0.05) as determined by one-way ANOVA. (c) Flow cytometry analysis of the nanoceria and doped nanoceria uptake into activated U937 cells analyzed by side scatter after 48 h of exposure to 50 μg mL–1 particles.

