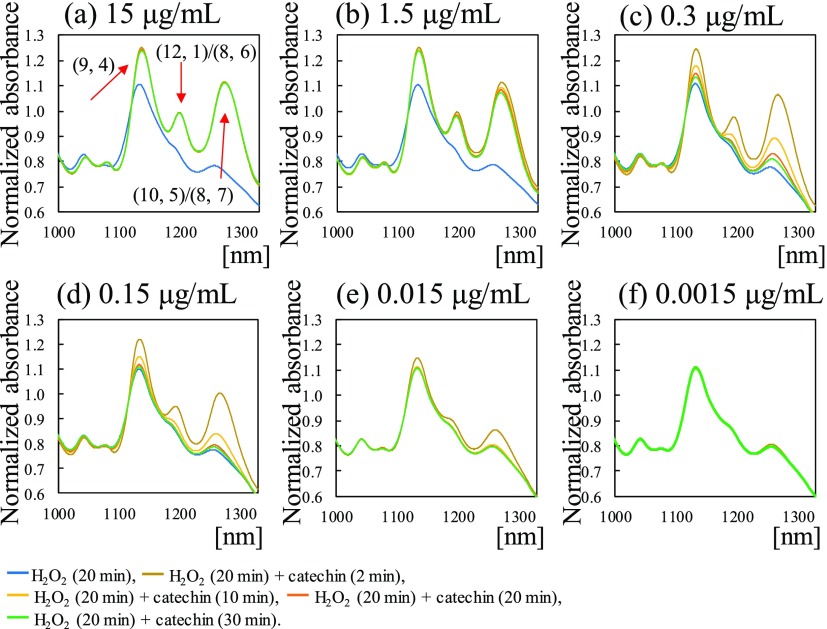
Figure 1.
NIR absorbance spectra of DNA–SWNT hybrids in the presence or absence of catechin. Catechin concentration ranged from 0 to 15 μg/mL. (a) 15, (b) 1.5, (c) 0.3, (d) 0.15, (e) 0.015, and (f) 0.0015 μg/mL. Blue line: DNA–SWNTs oxidized with 0.03% H2O2 solution for 20 min. Then, the oxidized DNA–SWNTs were incubated with catechin for 2 min (gold line), 10 min (yellow line), 20 min (orange line), and 30 min (green line). The arrow indicates the peak of (10, 5)/(8, 7) SWNTs. The absorbance values represent the mean of three independent measurements.

