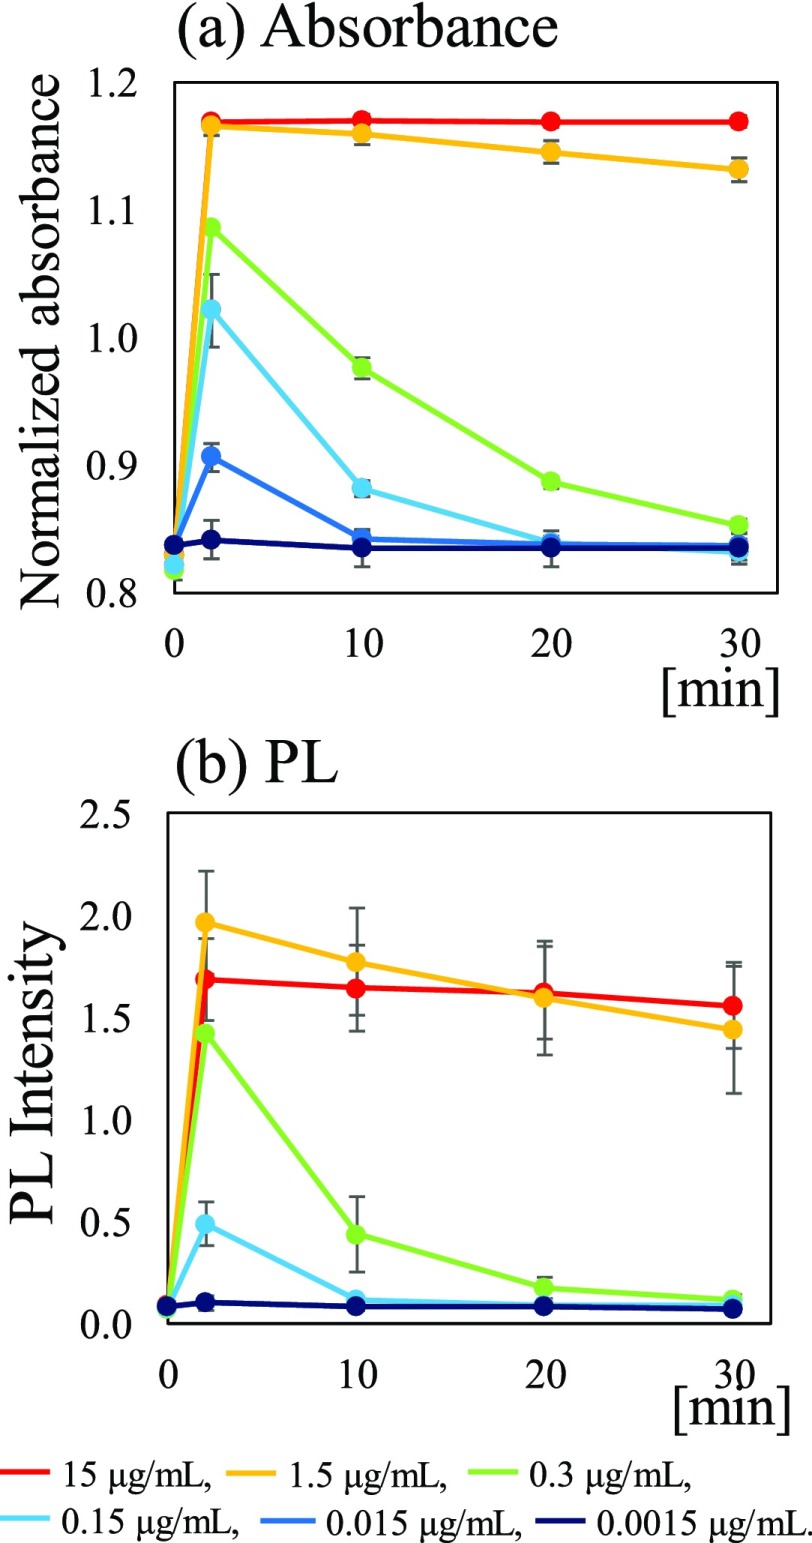
Figure 3.
Time dependence of (a) NIR absorbance values of (10, 5)/(8, 7) SWNTs and (b) NIR PL intensities of (9, 4) SWNTs. The value at 0 min reveals the values before adding catechin. After adding catechin, the values were measured after incubation 2, 10, 20, and 30 min. Catechin concentrations were 15 μg/mL (red line), 1.5 μg/mL (yellow line), 0.3 μg/mL (green line), 0.15 μg/mL (sky blue line), 0.015 μg/mL (dark blue line), and 0.0015 μg/mL (black line).

