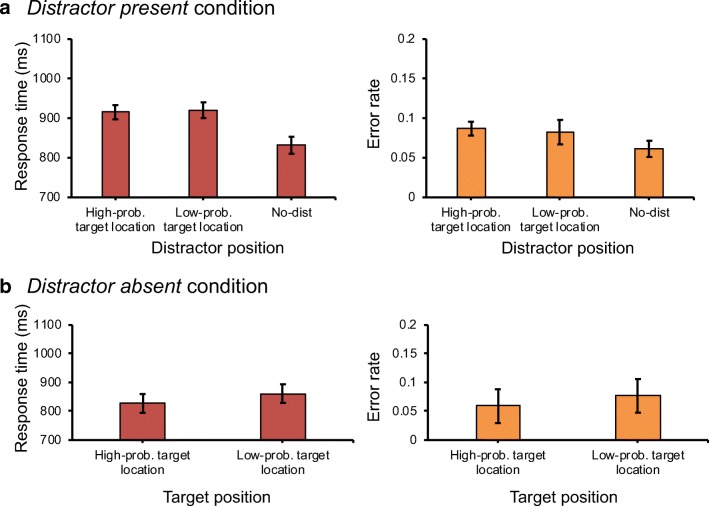
Fig. 2.
Results of Experiment 1. (A) The mean response times (left panel) and the mean error rates (right panel) as a function of the distractor position in distractor-present trials. (B) The mean response times (left panel) and the mean error rates (right panel) as a function of the target position in distractor-absent trials. Error bars here and in all other graphs represent 95% within-subject confidence intervals (Morey, 2008)

