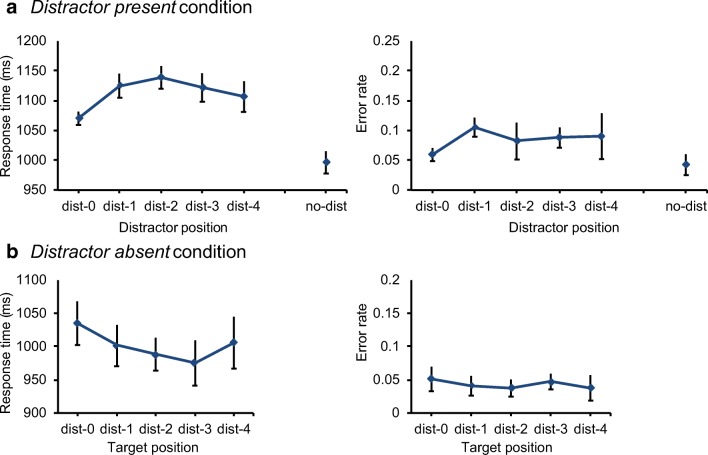
Fig. 4.
Results of Experiment 2. The spatial distribution of the interference in target selection as a function of the distractor position in distractor-present trials (A) and as a function of target position in distractor-absent trials (B). Mean response times are shown in the left panels and mean error rates are shown in the right panels. Dist-0 refers to the high-probability distractor location, dist-1 refers to the low-probability distractor location right next to the high-probability distractor location (left and right; 45° polar angle), and so on

