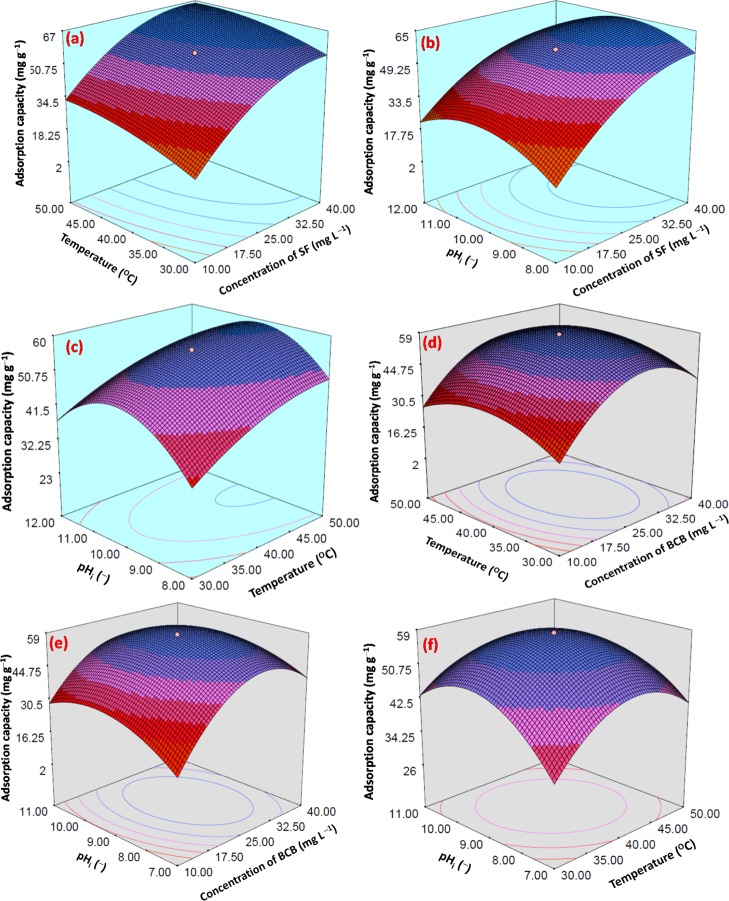
Figure 6.
Three dimensional interactive RSM plots of AC vs (a) temperature (°C) and concentration of SF (mg L–1), (b) pHi (−) and concentration of SF (mg L–1), and (c) pHi (−) and temperature (°C) for SF and AC vs (d) temperature (°C) and concentration of BCB (mg L–1), (e) pHi (−) and concentration of BCB (mg L–1), and (f) pHi (−) and temperature (°C) for BCB.

