. 2017 Aug 14;63(3):215–223. doi: 10.5606/tftrd.2017.351

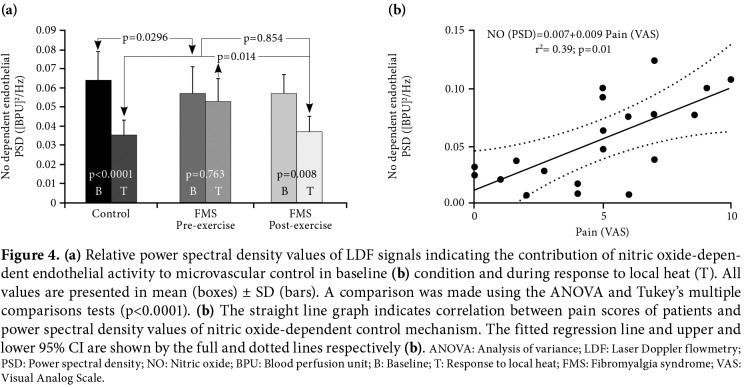
Figure 4. (a) Relative power spectral density values of LDF signals indicating the contribution of nitric oxide-depen- dent endothelial activity to microvascular control in baseline (b) condition and during response to local heat (T). All values are presented in mean (boxes) ± SD (bars). A comparison was made using the ANOVA and Tukey’s multiple comparisons tests (p<0.0001). (b) The straight line graph indicates correlation between pain scores of patients and power spectral density values of nitric oxide-dependent control mechanism. The fitted regression line and upper and lower 95% CI are shown by the full and dotted lines respectively (b). ANOVA: Analysis of variance; LDF: Laser Doppler flowmetry; PSD: Power spectral density; NO: Nitric oxide; BPU: Blood perfusion unit; B: Baseline; T: Response to local heat; FMS: Fibromyalgia syndrome; VAS: Visual Analog Scale.

Figure 4