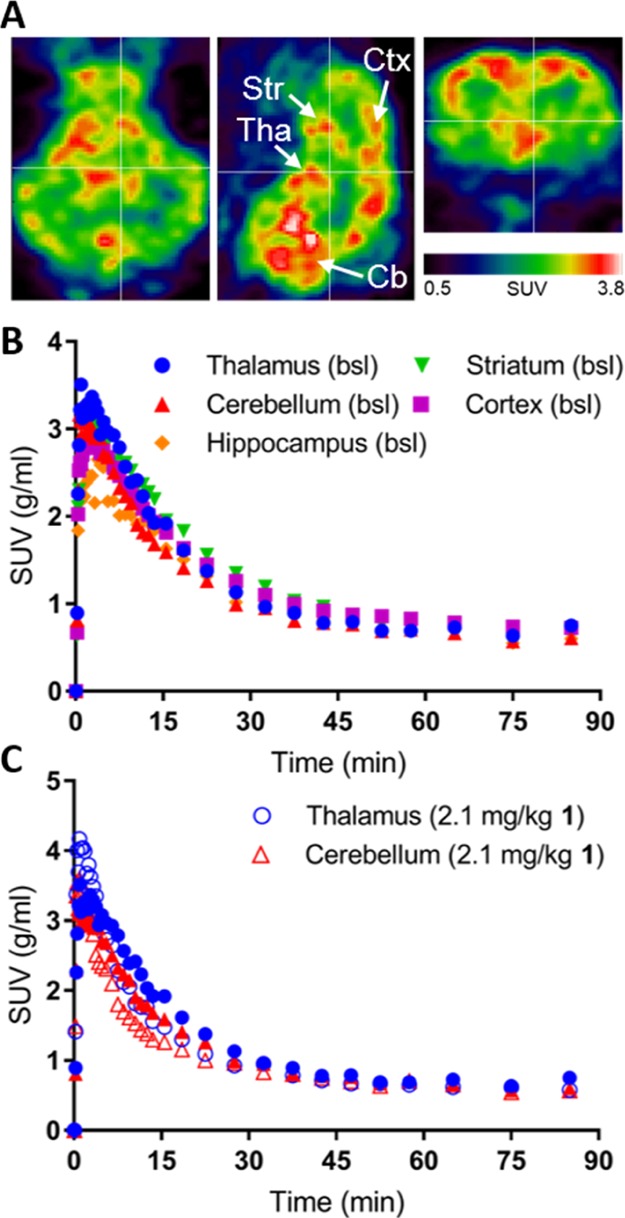
Figure 3.

(A) PET images of the pig brain in the transverse, sagittal, and coronal planes (left to right). (B) Time–activity curves of [11C]1 in the indicated regions of the pig brain. (C) Time–activity curves of [11C]1 in the thalamus and cerebellum at the baseline (closed symbols) and after administration of 2.1 mg/kg unlabeled 1 (coadministrated with the tracer, open symbols). SUV: standardized uptake value. Tha: thalamus, Str: striatum, Ctx: cortex, Cb: cerebellum.
