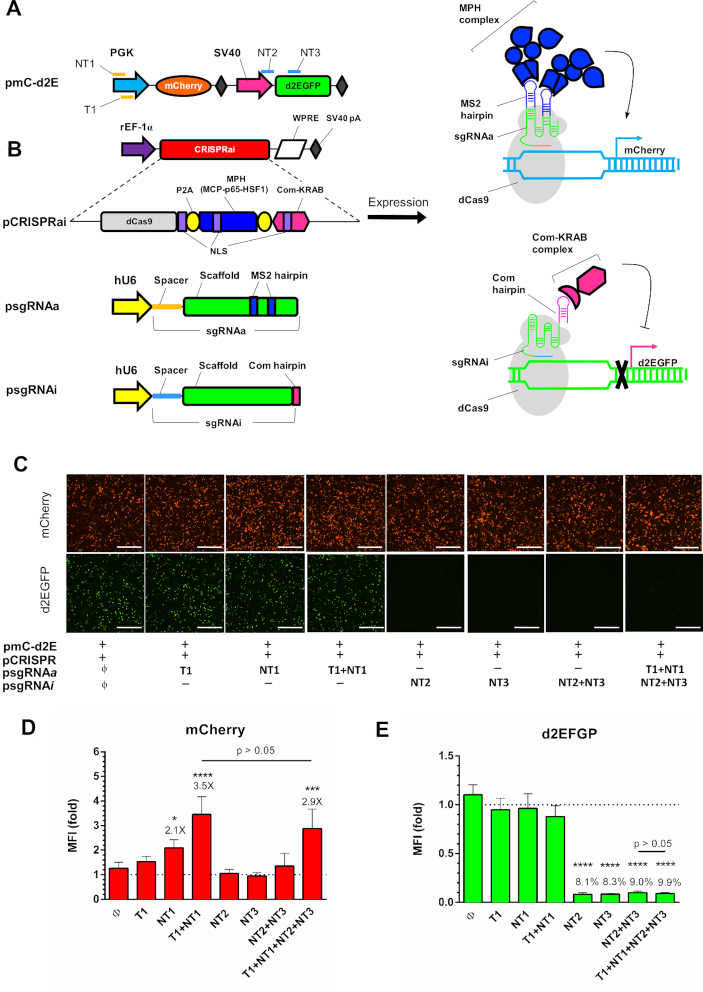
Figure 1.
Design and validation of CRISPRai system. (A) Illustration of reporter plasmid. mCherry was driven by PGK promoter; d2EGFP was driven by SV40 promoter. NT1, T1, NT2 and NT3 indicate the sgRNA targeting positions. (B) Plasmids used for the CRISPRai system. pCRISPRai co-expressed the CRISPRai module (dCas9, MPH and Com-KRAB) under the rat EF-1α promoter with a WPRE sequence at the 3′ end. dCas9, MPH and Com-KRAB were separated by P2A sequences and contained the SV40 nuclear localization signal (NLS). psgRNAa and psgRNAi expressed the sgRNAa and sgRNAi under the hU6 promoter. sgRNAa comprised the spacer targeting NT1 or T1 on the PGK promoter and the scaffold sequences containing two MS2 binding aptamers at the tetraloop and stem loop 2. sgRNAi comprised the spacer targeting NT2 or NT3 on the d2EGFP cassette and the scaffold sequence with Com binding aptamer at the 3′ end. dCas9 can associate with sgRNAa to recruit MPH for mCherry activation while dCas9 also associates with sgRNAi to recruit Com-KRAB for d2EGFP suppression. (C) Fluorescence microscopic images. The CHO DUXB11 cells were co-transfected with pmC-d2E, pCRISPRai and different combinations of psgRNAa and psgRNAi, and observed at 1 day post-transfection. (D, E) Flow cytometry analysis of mCherry and d2EGFP expression at day 2. The mean fluorescence intensity (MFI) of each group was normalized to that control group (ϕ). ****P < 0.0001. ***P < 0.001. *P < 0.05. Bar, 500 μm. The fold change of mCherry activation and percentages of d2EGFP suppression are shown above the bars. The data represent means ± SD of three independent culture experiments.

