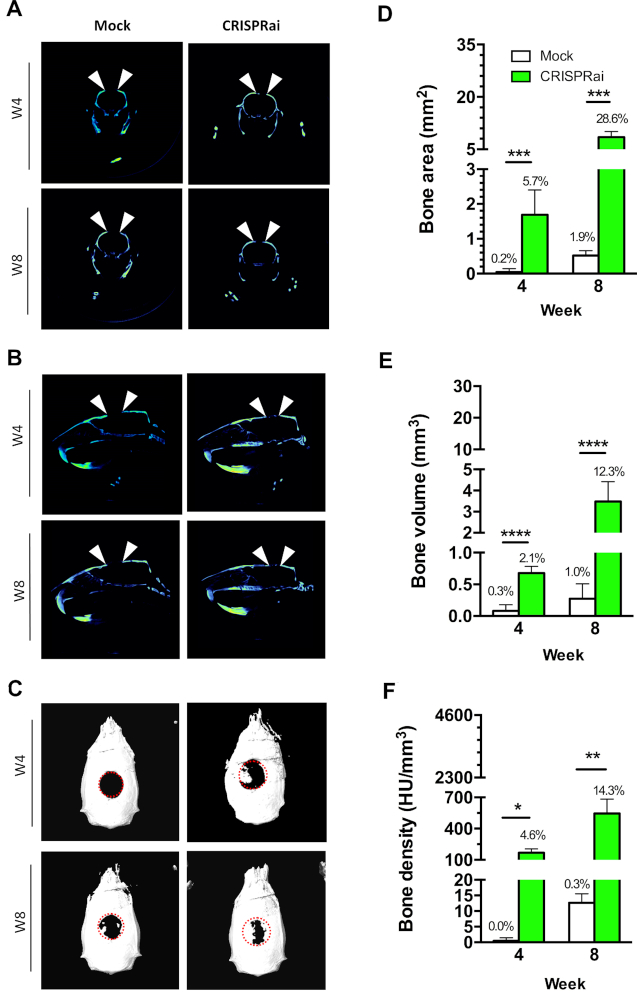
Figure 5.
In vivo Bone healing evaluated by μCT. The frontal (A), sagittal (B) and top (C) views of μCT imaging. (D–F) Quantitative analysis of bone area, volume and density. We seeded the Bac-aS-iP/Bac-Cre-transduced (CRISPRai group, n = 6) or mock-transduced (Mock group, n = 6) rBMSC into gelatin scaffolds as in Figure 4, and implanted the cell/scaffold constructs into the critical-size (6 mm in diameter) calvarial bone defects in rats. At weeks 4 and 8, the rats were subjected to μCT scanning to obtain the nascent bone area, volume and density. The percentages of healing, as calculated by dividing the nascent bone area (or volume, density) within the defect by those in the original defect, are shown above the bars (D–F). ****P < 0.0001. *** P < 0.001. ** P < 0.01. *P < 0.05.

