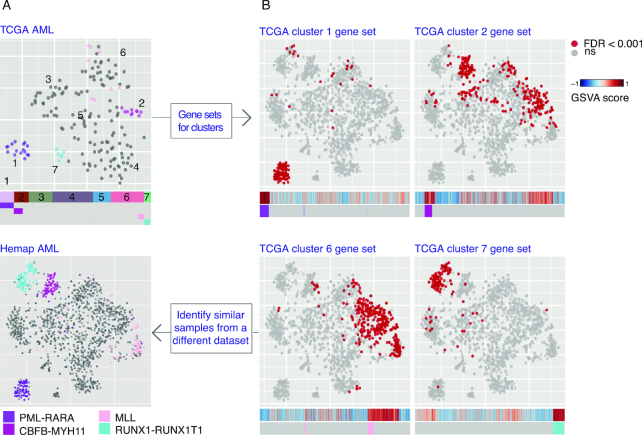
Figure 4.
Evaluation of disease subtypes across datasets. Comparison of sample clustering on the t-SNE maps for TCGA AML RNA-seq samples (N = 162) and Hemap AML is shown. (A) The data-driven cluster assignment (TCGA clusters 1–7) can be compared with sample molecular annotations colored on the map and the heatmaps below. (B) Enrichment scores for TCGA cluster gene sets that matched samples with common fusion genes (clusters 1, 2, 6 and 7) are colored on the Hemap AML map (significant enrichment adj. P-value < 0.001 in red). The raw GSVA scores are shown below as a heat map (red tones indicate high expression of the gene set and blue tones low expression).

