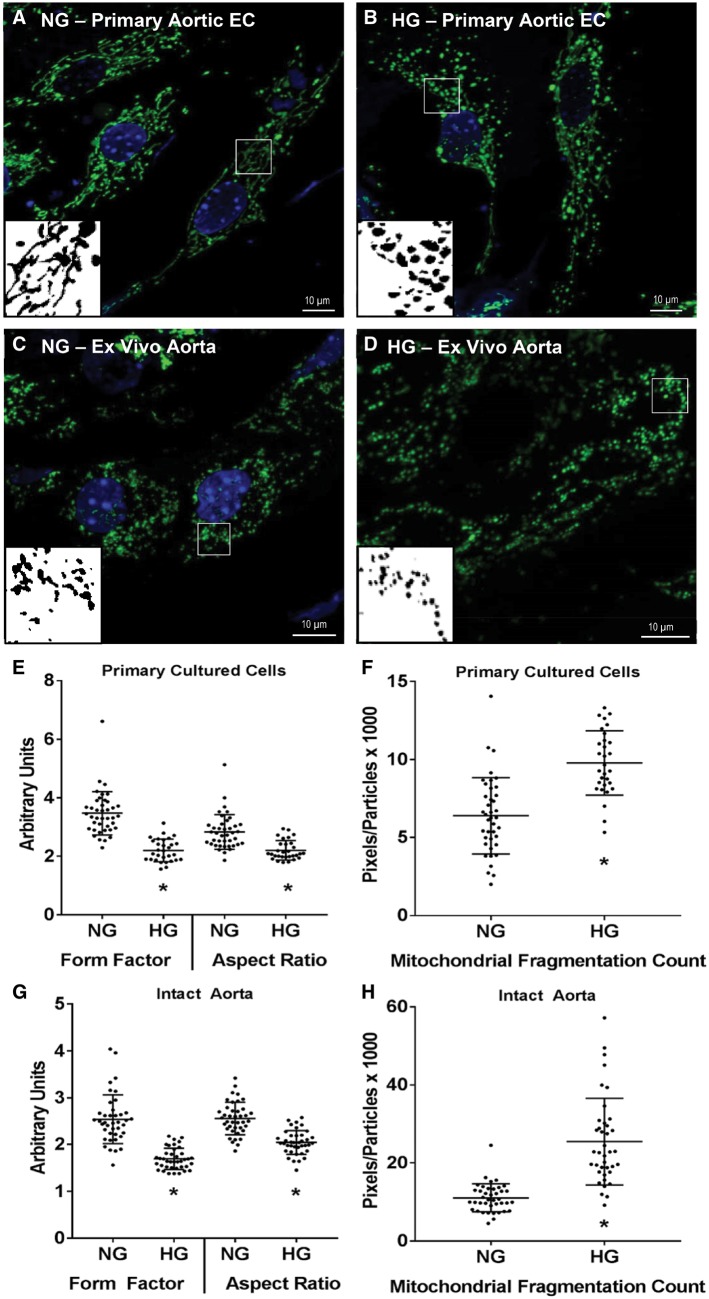
Figure 6.
Effect of ex vivo high glucose exposure on mitochondrial structure in primary culture aortic ECs or intact aortas from a Cre+/Dendra2+ mouse. Representative micrographs of normal and high glucose incubated cells and aortas are shown in A–D. In primary cultured cells high glucose caused a decrease in FF and AR (E) and an increase in the MFC (F). Similar changes in FF, AR, and MFC were observed in aortas incubated in high glucose overnight (G and H). All images were taken at ×100 magnification. Scale bar = 10 µm. Green: Dendra2; Blue: DAPI. Inserts are processed, binary examples from ImageJ. n = 30–40 cells in each group, three or four biological replicates. *P < 0.05 vs. normal glucose, Mann–Whitney rank sum test (E, G, H) or unpaired t-test (F). • indicates a measurement from an individual cell.

