Figure 1.
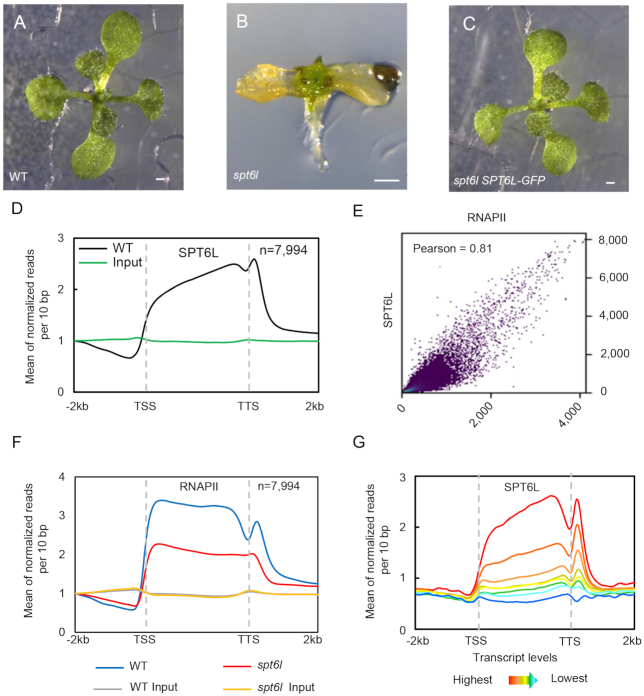
SPT6L associates with transcribed genes and promotes transcription (A) to (C) 10-day-old WT (A), spt6l (B) and spt6l ProSPT6L:SPT6L-GFP (C) seedlings. Bar = 0.5 mm. (D) Mean density of SPT6L occupancy at the SPT6L target genes. Plotting regions were scaled to the same length as follows: 5′ ends (–2.0 kb to transcription starting site [TSS]) and 3′ ends (transcription termination site [TTS] to downstream 2.0 kb) were not scaled, and the gene bodies were scaled to 3 kb. Y-axis represents the means of normalized reads (1× sequencing depth normalization) per 10 bp non-overlapping bins, averaged over two replicates (SPT6L) or one replicate (Input). The number of genes were indicated (n). (E) Reads correlation between SPT6L and RNAPII ChIP-seq (Pearson correlation value was indicated). The entire genome was equally divided into 100 bp non-overlapping bins and the numbers of reads were averaged over two replicates. (F) Mean density of RNAPII occupancy in WT and spt6l mutant at SPT6L target genes. Plotting regions were the same as in Figure 1D. Y-axis values were the means of normalized reads (1× sequencing depth normalization) per 10 bp non-overlapped bins, averaged over two replicates or one replicate (for inputs in WT and spt6l background). (G) Mean density of SPT6L occupancy at different transcription groups. By sorting the transcript level of each gene from high to low, all Arabidopsis genes were clustered into eight groups. Y-axis values are the means of normalized reads (1× sequencing depth normalization) per 10 bp non-overlapped bins, averaged over two replicates.

