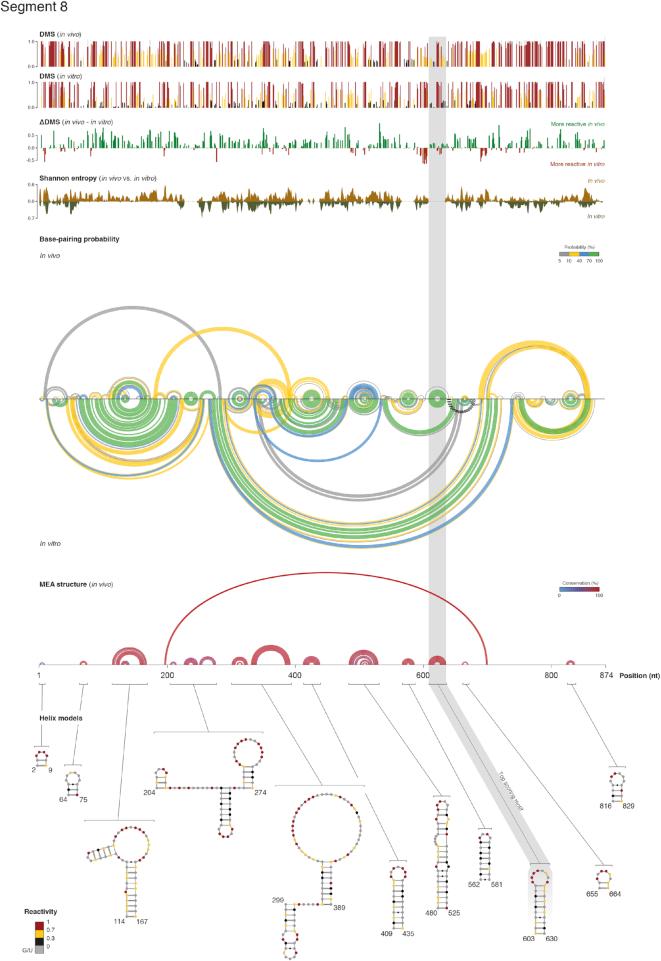
Figure 2.
Transcriptome-wide in vivo secondary structure model of IAV mRNAs. In vivo and in vitro DMS reactivities, reactivity difference (ΔDMS), Shannon entropies, base-pairing probabilities, minimum expected accuracy (MEA) structure, and helix models with superimposed in vivo DMS reactivities for IAV segment 8, NS (NS1/NEP). Reactivity values are reported as the arithmetic mean of two biological replicates. Error bars represent SDs. Base-pairs are depicted as arcs, colored according to their probabilities. Green arcs correspond to base-pairs with P ≥ 0.7. Black dashed arcs correspond to pseudoknots. Regions with multiple overlapping arcs (high Shannon entropies) correspond to regions that are likely to form alternative structures. Base-pairs in the MEA structure are depicted as arcs, colored according to their conservation as determined by multi-sequence alignment of IAV mRNAs.

