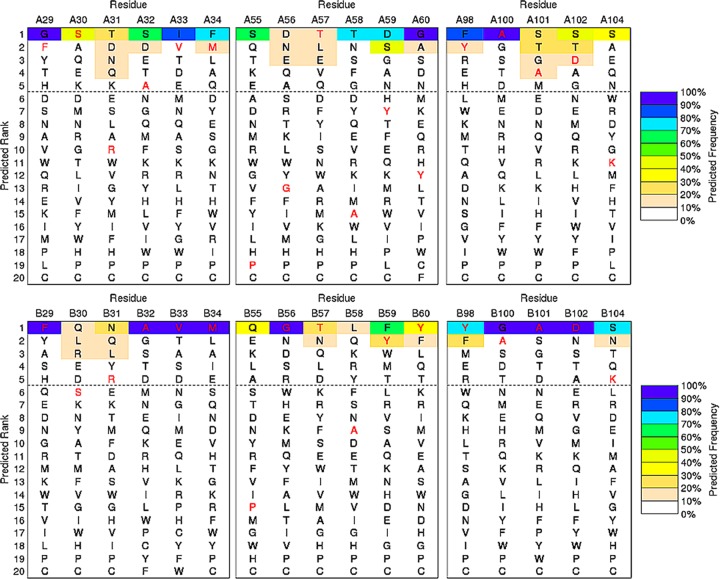
Figure 2.
Selected sequence–tolerance profiles of the A-chain conformer (top graph) and B-chain conformer (bottom graph) of A3 determined by the RosettaBackrub method. Sequences colored red denote the wild-type residue. The color spectrum of each profile designates the predicted frequency of the sequence-site placement along the A- or B-chain conformers. The horizontal line is arbitrarily positioned to highlight the five top-ranking sequences.

