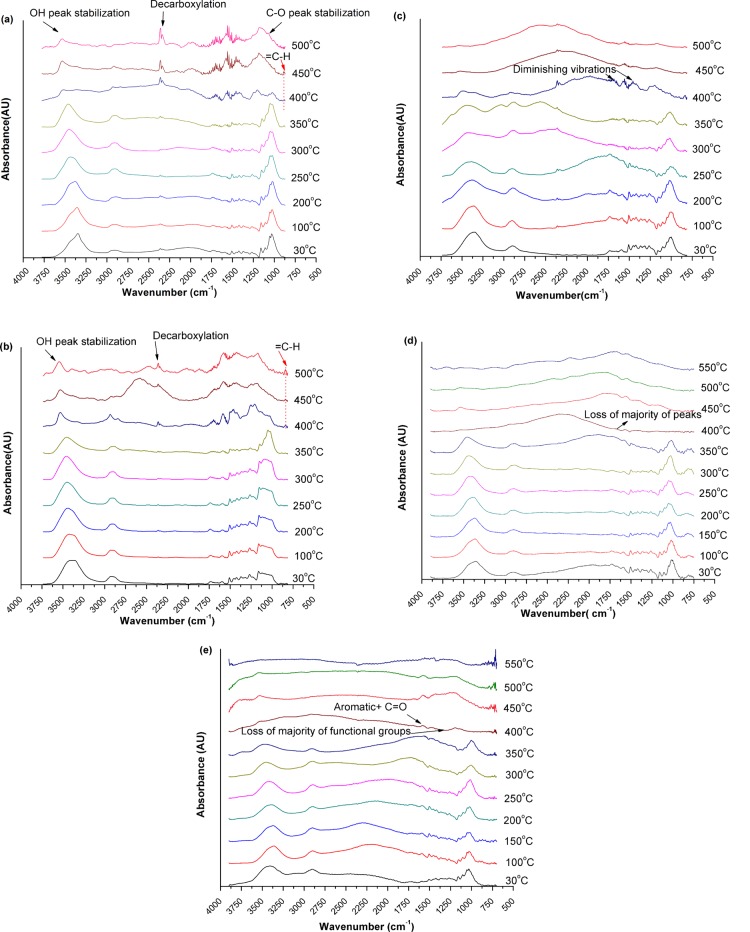
Figure 11.
(a) Synchrotron FTIR spectra observed during thermal breakdown of biomass treated with 0.05 M hydrochloric acid. (b) Synchrotron FTIR spectra observed during thermal breakdown of biomass treated with 0.1 M hydrochloric acid. (c) Synchrotron FTIR spectra observed during thermal breakdown of biomass treated with 0.5 M hydrochloric acid. (d) Synchrotron FTIR spectra for thermal breakdown of biomass treated with 1 M acid. (e) Synchrotron FTIR spectra for thermal breakdown of biomass treated with 2 M acid.

