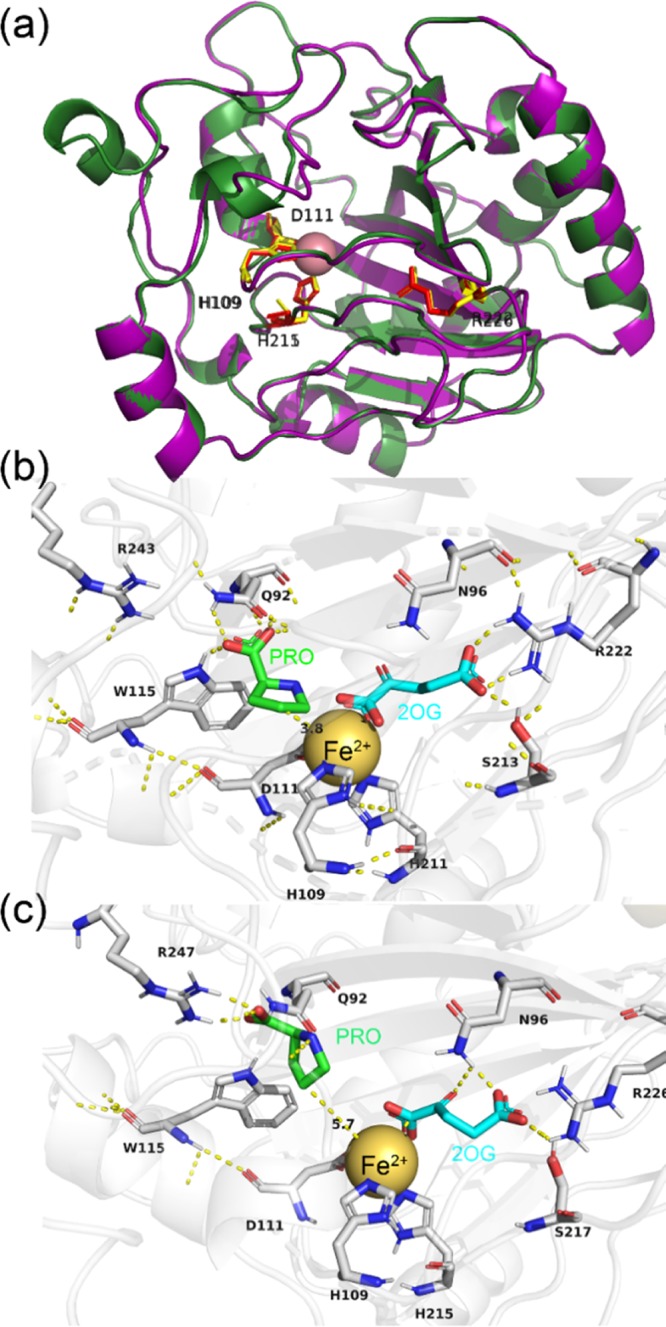
Figure 3.

Biophysical analysis of the dioxygenases. (a) Structural alignment of KaPH1 and P4H. The model of KaPH1 and P4H is displayed in purple and green, respectively. Molecular docking results of 2-OG and substrate l-proline in (b) KaPH1 and (c) P4H. The distances between C4 of l-proline/C1 of 2-OG and Fe(II) are illustrated by yellow dashed lines.
