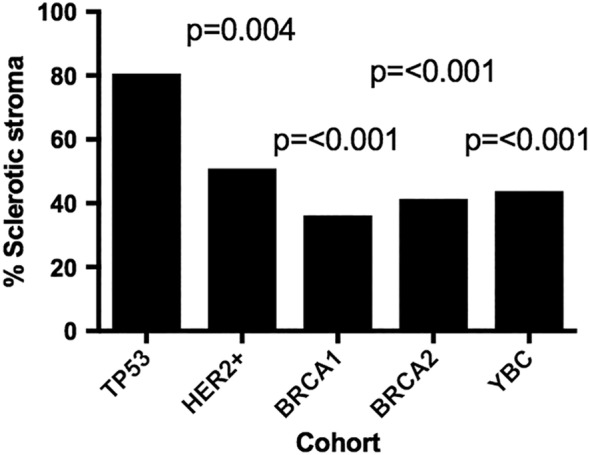
Figure 2.

TP53 carriers had a significantly higher proportion of sclerotic tumour stroma. The bar chart shows the frequencies of sclerotic stroma between cohorts. Statistics were performed on TP53 carriers against each of the other groups using the Pearson Chi‐square test. Missing data were excluded.
