Figure 2.

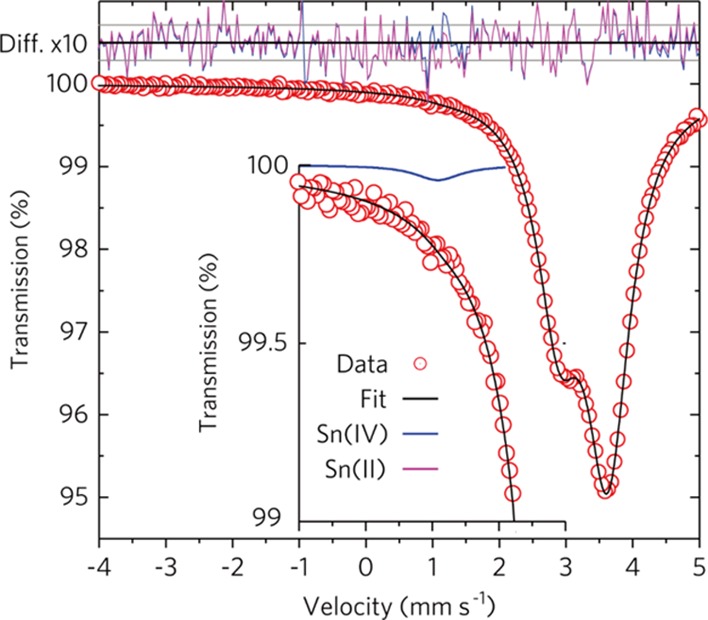
Room-temperature Mössbauer spectra of fully dense SnSe. Top: difference plot for fits with a single SnSe doublet fit (purple) and a fit with an additional Sn(IV) singlet (blue). The scale is magnified by a factor 10. The gray lines represent the ±1σ deviation calculated from the counting statistics. Center: Mössbauer spectral data, red dots, and total fit, black line, for the model with SnSe and a minor Sn(IV) component. Inset: vertically enlarged spectrum and fit components in the −1 to 2 mm/s range. The Sn(IV) minority component displayed in blue amounts to 0.35 at. %. The SnSe doublet is displayed in magenta. Data points for data are scaled to match the error bar.
