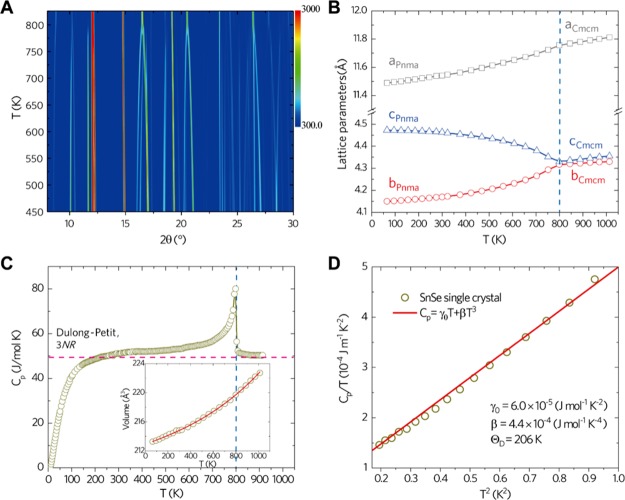
Figure 3.
Temperature-dependent synchrotron XRD patterns and heat capacity data of SnSe. (A) Temperature-dependent XRD patterns showing the peak evolution with temperature. (B) Lattice parameters determined from Rietveld refinement and plotted as a function of temperature along a, b, and c directions. (C) Cp as a function of temperature below and above Tc (vertical blue dashed line). Inset: unit cell volume plotted as a function of temperature. (D) Estimated Debye temperature (ΘD) from the plot of Cp/T vs T2.

