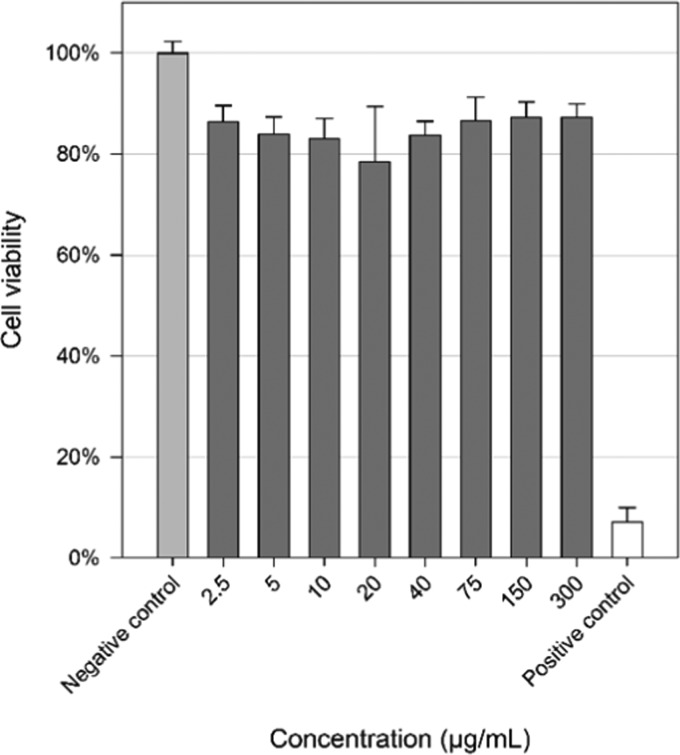
Figure 6.
Cytotoxicity of HepG2 cells in the resazurin assay after exposure to different concentrations (μg mL–1) of Fe3O4–LDOPA–PEG–MANOTA NPs for 24 h. Results are expressed as mean ± standard deviation (three independent experiments). Statistical difference was checked using a one-way analysis of variance (ANOVA) followed by a Dunnett test (p < 0.05).

