
Figure 9.
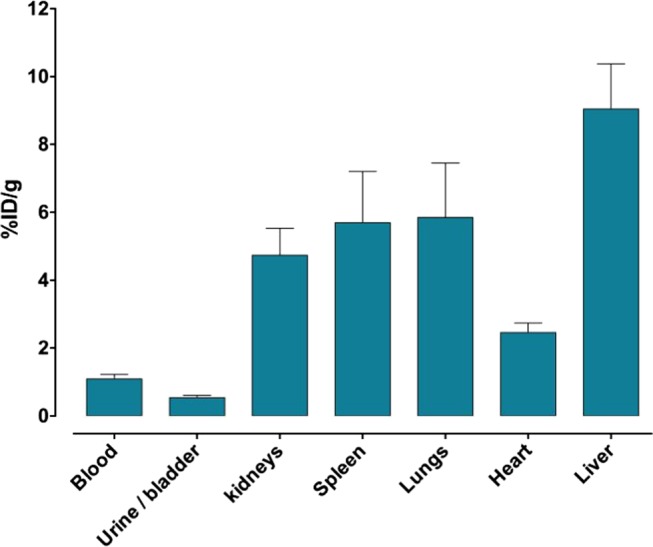
Evaluation of the biodistribution of Fe3O4–LDOPA–PEG–MANOTA–64Cu NPs 48 h after intravenous injection in mice. Values represent the mean ± standard deviation of the percentage of the injected dose per gram of tissue in different organs (n = 4).