Figure 7.

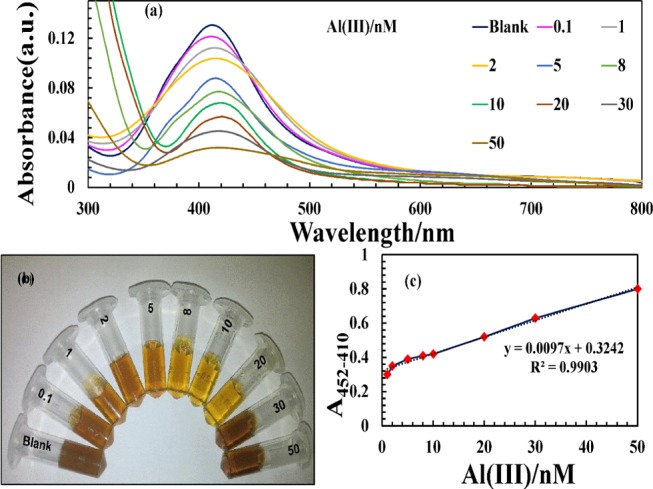
(a) UV–vis spectra, (b) optical images of 5H-I2CA@AgNPs after the addition of different Al(III) ion concentration of 0.1–50 nM, and (c) plot of absorption intensity vs various concentrations of Al(III).

(a) UV–vis spectra, (b) optical images of 5H-I2CA@AgNPs after the addition of different Al(III) ion concentration of 0.1–50 nM, and (c) plot of absorption intensity vs various concentrations of Al(III).