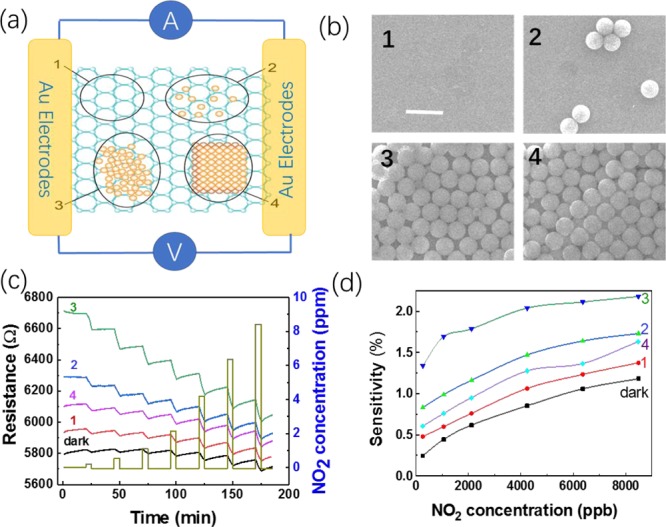
Figure 4.

Sensing performance of the graphene gas sensor with localized illumination for four distinct PS bead coverage densities. (a,b) are schematic drawing and SEM images of the graphene with four PS beads distributions. The scale bar is 2 μm. (c) Dynamic-sensing response in dark and with four areas of localized 1064 nm light illumination (d) and corresponding sensitivity.
