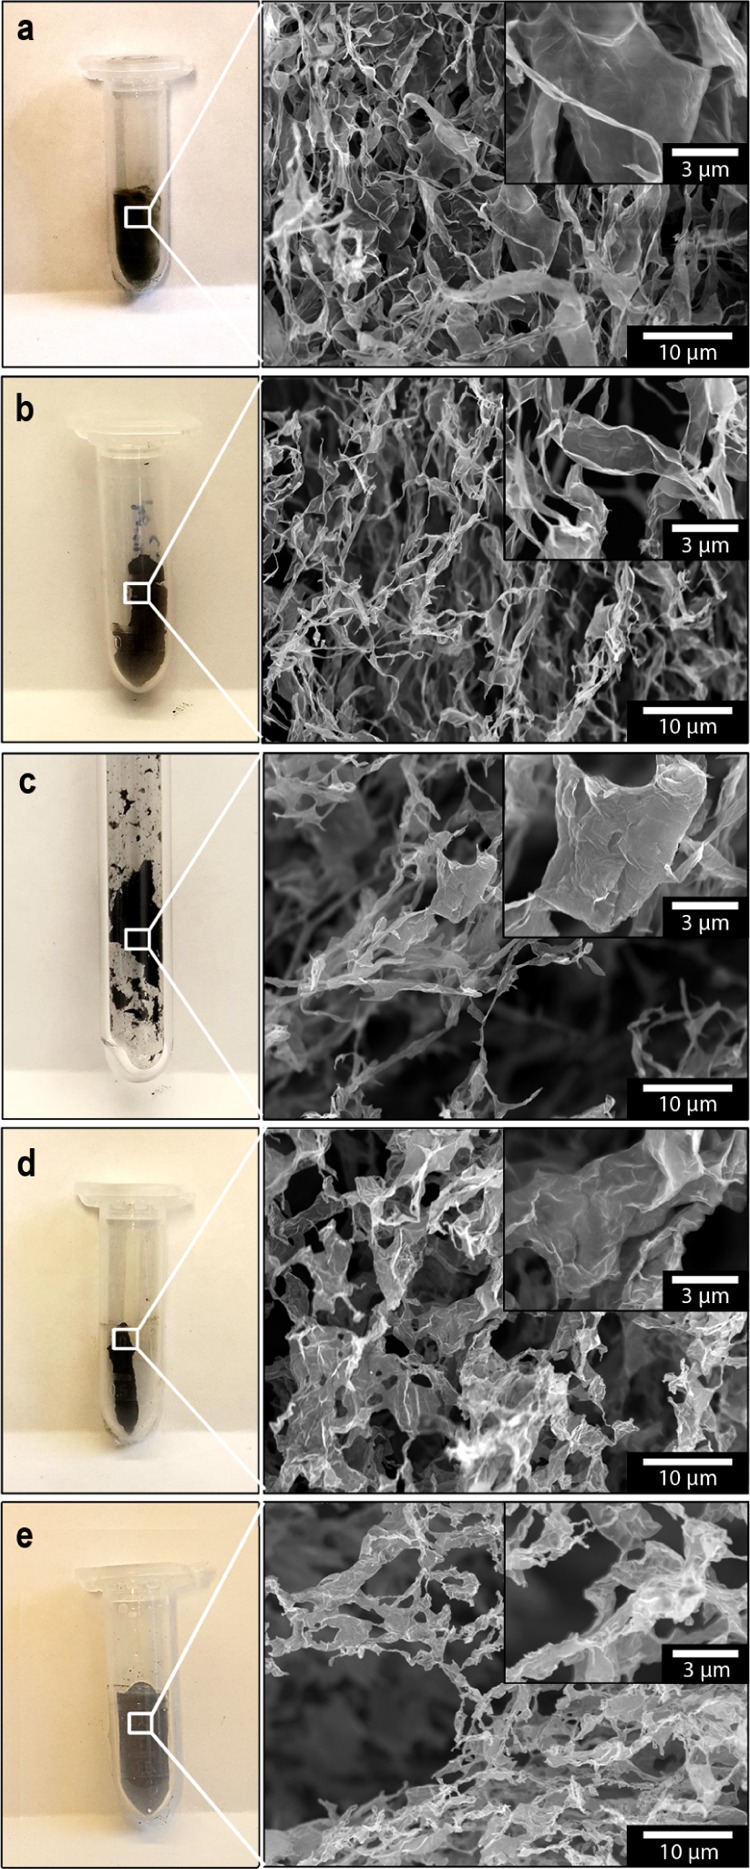
Figure 2.

Micrograph showing GO and rGO sheets after 72 h of freeze-drying. (a) GO, (b) reduced GO at 150 °C in vacuum (60 min), (c) high-temperature reduction at 1000 °C (5 s), (d) chemically reduced GO (NaOH buffer), and (e) chemically reduced GO (NH4OH buffer).
