
Figure 8.
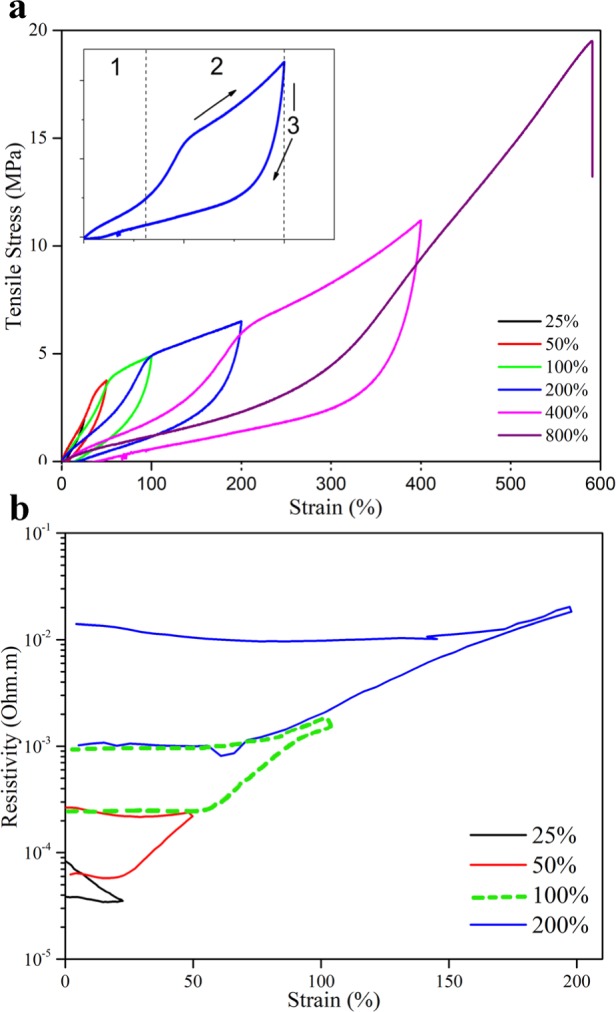
Strain–stress curves for CNT/NR (a) with 8 wt % filler content and the simultaneous resistivity cycles after each stretching event for the same CNT/NR sample (b).
Official websites use .gov
A
.gov website belongs to an official
government organization in the United States.
Secure .gov websites use HTTPS
A lock (
) or https:// means you've safely
connected to the .gov website. Share sensitive
information only on official, secure websites.
Strain–stress curves for CNT/NR (a) with 8 wt % filler content and the simultaneous resistivity cycles after each stretching event for the same CNT/NR sample (b).