

Abstract
Calixarene-functionalized water dispersible silver nanoparticles have been synthesized and characterized on the basis of UV–vis, IR, X-ray diffraction, and high-resolution transmission electron microscopy analysis, and their sensing properties toward metal ions have been investigated. They selectively detect Hg2+ and Hg0 in solution and vapor phases, respectively, with distinct color change. Interference study with mixture of metal ions revealed no interference from any other metal ions used in this study. Their mechanism of detection involved Hg2+-aided displacement of calixarene moiety from the surface of the functionalized nanoparticles, followed by the formation of Ag–Hg amalgam due to interaction of Hg2+ with Ag0 and also the formation of assembly of Ag0 nanoparticles by dipole–dipole interaction of the bare-surfaced nanoparticles. Electrochemical study revealed that with the aid of functionalized nanoparticles, Hg2+ can be detected amperometrically with high sensitivity. The detection limits obtained for Hg2+ by UV–vis study and amperometry are 0.5 nM (0.1 ppb) and 10 nM (2 ppb), respectively. The new material has been used to detect Hg2+ in aqueous real sample and Hg0 in soil sample.
Introduction
Widespread water contamination triggered by heavy-metal ions is a global environmental concern, and among these heavy-metal ions, mercury is one of the most toxic, which adversely affects human health.1−4 The sources of mercury include gold mining operation, coal mining power plants, natural degassing of the earth surface, etc., and it affects millions of people working in these industries.5,6 Mercury in its all three oxidation states (0, +1, and +2) is highly toxic to the living species, among which Hg2+ has high solubility in water and hence found in surface water in maximum quantity.7−9 It can damage kidney, central nervous system, and cardiovascular respiratory system.7,10,11 According to US-EPA guidelines, maximum tolerance of mercury in drinking water and food is 10 nM (2 ppb) only.12 Therefore, detection of mercury at low concentration in aqueous media is important. Several instrument-based techniques are available for the detection/estimation of mercury, but they require costly instrument, highly skilled operators, and tedious sample preparation methods.13−15 Some of these methods lack accuracy at very low concentration, viz., ppb level. Therefore, simple alternative method(s) for detection of mercury with high selectivity and sensitivity is most desirable.
In the recent era, different kinds of nanomaterials are used for sensing of metal ions and molecules using colorimetric and fluorimetric techniques.16−18 Among various alternative methods for detection of metal ions, colorimetric technique of sensing is one of the most promising methods of detection and it has gained considerable interest due to its simple operation.19,20 In the area of colorimetric sensing, the use of metal nanoparticles as sensing material is growing rapidly for the detection of various metal ions.21−26 This method has attracted attention because of their extremely high visible-region extinction coefficients (∼109 M–1 cm–1), which is several orders of magnitude higher than that of organic dyes.27 Surface plasmon resonance (SPR) of the metal nanoparticles exhibits intense color, which is highly sensitive toward its size, shape, and interparticle distances.27,28 Interaction of these nanoparticles with analytes causes aggregation and/or change in size, shape, interparticle networking pattern, etc., resulting in changes in SPR absorption band and color of the solution, which is easily detectable by the naked eye even at low concentration.29−31 Because of this unique property and also due to their simple and rapid action with high selectivity and sensitivity, the use of nanoparticles as colorimetric sensing material has become an emerging area of research. Among metal-based nanoparticles, both gold nanoparticles (AuNPs) and silver nanoparticles (AgNPs) are of particular interest because of their high sensitivity and distinct color change, which can be noted even if a minor change occurs in the nanoparticles’ environment.27,32,33 Between gold and silver, the latter has been chosen in the present work to make it cost-effective as silver is much cheaper than gold and silver nanoparticles are expected to perform similar to gold nanoparticles.
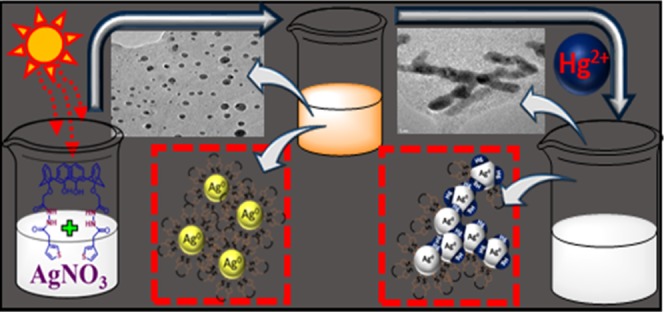
In the present work, silver nanoparticles were prepared with the aid of sunlight using newly designed thiophene-substituted calixarene derivative (ThC) as capping and stabilizing agent. It is documented in the literature that bare-surfaced nanoparticles are prone to aggregate, and therefore, some capping agent is required to make them discrete nanoparticles.23,26,34,35 In this case, designed calixarene derivative incorporating thiophene moiety is chosen as capping and stabilizing agent with the aim that the sulfur atom of the thiophene unit connected to calixarene can make strong interaction with the surface of the silver nanoparticles making an effective capping, and this preorganized calixarene moiety can provide platform for interaction with incoming analytes.36 These calixarene-modified silver nanoparticles (ThC-AgNPs) have been used for detection of metal ions in aqueous media, and it has been observed that they detect Hg2+ with high selectively, sensitivity, and sharp color change over 17 other metal ions used in this study. They detect not only Hg2+ in aqueous media, but also Hg0 in vapor and liquid phases.
These ThC-AgNPs have also been used for the detection of Hg2+ electrochemically using amperometric technique, in which a constant potential of working electrode is maintained and change in current is measured with incremental addition of Hg2+.37,38 This amperometric method has also detected Hg2+ in aqueous media with high sensitivity. Herein, we report details of the synthesis of modified calixarene and the preparation of calixarene-modified silver nanoparticles and their application as colorimetric sensor for Hg2+ and Hg0 and amperometric sensor for Hg2+ with high sensitivity.
Results and Discussion
Synthesis and Characterization of ThC
The route followed for the synthesis of ThC is depicted in Scheme 1, and characterization data such as IR, 1H NMR, electrospray mass spectrometry (ES-MS), and elemental analysis (C, H, and N) are given in Experimental Section. Elemental analysis and the mass data obtained experimentally are in excellent agreement with the values calculated on the basis of the proposed composition of the compounds. The mass and IR spectra of compound ThC are shown in Figures S2 and S3 (Supporting Information), respectively. The IR spectra exhibited strong bands at 3385 and 1674 cm–1, which are assigned to ν(OH) and ν(C=O).39 The 3-thiophene acetic acid ring of ThC exhibited bands at 1457 and 763 cm–1, which are due to C=C and Cα–H of the ring, respectively.40 The 1H NMR spectra of the compound ThC are shown in Figure S4 (Supporting Information), which exhibited two doublets at δ 4.23 and 3.54 (J = 13.54 and 13.54 Hz) for the Ar–CH2–Ar methylene protons, suggesting that the compound exists in cone conformation in the solution.41 The aromatic protons of the calix unit appeared as two doublets and two triplets at δ 7.18 (d, J = 7.54 Hz), δ 7.06 (d, J = 7.61 Hz), δ 6.89 (t, J = 7.60 Hz), and δ 6.75 (t, J = 7.52 Hz), respectively, which supports the cone conformation of the calix unit.41 The amide −NH protons of ThC appeared at δ 10.22 and δ 9.03, and the phenolic −OH protons appeared at δ 8.09. The CH2 protons connecting the phenolic oxygen atoms and amide moiety appeared at δ 4.69. The methylene bridge (−CH2−), which connected the amide unit and thiophene moiety, appeared at δ 3.64. The signals for CH protons at 2, 4, and 5 positions of the thiophene ring appeared at 7.28 (s), 7.10 (d) and 7.36 (d), respectively. The analytical and spectroscopic data are therefore consistent with the proposed structure of the compound, shown in Scheme 1.
Scheme 1. Route for the Synthesis of Ligand ThC.

(i) Acetone, K2CO3, BrCH2COOCH3, reflux 24 h; (ii) CHCl3/MeOH, NH2NH2·H2O, reflux 24 h; (iii) 1-ethyl-3-(3-dimethylaminopropyl)carbodiimide (EDC)·HCL, 3-thiophene acetic acid, room temperature stirring 24 h.
Synthesis and Characterization of Silver Nanoparticles (ThC-AgNPs)
Thiophene-functionalized calix[4]arene-capped silver nanoparticles (ThC-AgNPs) were synthesized with the aid of sunlight, as described in Experimental Section. However, this synthesis is highly sensitive toward different parameters and experimental conditions used, for example, ratio of AgNO3 to ThC, ratio of methanol to water, and time of exposure of the solution to sunlight. Low concentration of AgNO3 or higher concentration of methanol leads ThC-AgNPs toward aggregation. If exposure time of solution to sunlight is about 1 h or more, a dark brown precipitate separates. A number of experiments were carried out with variation in different parameters, and the optimized parameters for the best result are mentioned in the Experimental Section. An attempt has been made to synthesize surface-modified AgNPs using AgNO3 and individual compounds, 3-thiophene acetic acid, oxalyldyhydrazide, and 1,3-o-hydrazine calix[4]arene derivative, the detailed experimental procedure of which is given in the Supporting Information (Figure S5). However, the UV–vis spectra of the product, shown in Figure S5 (Supporting Information), exhibit no nanoparticle formation. The result thus suggests that ThC has a role to play in the formation and stabilization of nanoparticles of desired size and is essential for this reaction.
The functionalized nanoparticles, ThC-AgNPs, were characterized on the basis of UV–vis, IR, X-ray diffraction (XRD), and transmission electron microscopy (TEM) studies. The UV–vis spectra of ThC-AgNPs, shown in Figure 1, exhibit a strong band at 432 nm, which is the characteristic SPR absorption band observed for AgNPs.26 The IR spectra of ThC-AgNPs (Figure S6, Supporting Information) exhibited that the bands at 1457 and 763 cm–1, which are due to C=C and Cα–H of the thiophene ring of ThC, respectively, have almost disappeared, indicating the involvement of thiophene ring in its attachment onto the surface of the nanoparticles, probably through the sulfur atoms. The band at 1674 cm–1, which was assigned to ν(C=O) of ThC, has also splitted and shifted to 1637 and 1621 cm–1 due to attachment of ThC onto the AgNPs surface. Powder XRD pattern of ThC-AgNPs was recorded by casting them on a glass plate and drying under vacuum, and the diffractogram, shown in Figure 2, revealed the formation of silver nanoparticles by showing the characteristic peaks at 2θ values of 38.13, 44.23, 64.43, and 77.46° corresponding to the 111, 200, 220, and 311 planes.23 The TEM image of ThC-AgNPs was recorded and is displayed in Figure 3, which reveals that the nanoparticles are discrete, not aggregated, and almost spherical in shape (Figure 3a) with average size of 3–5 mm (Figure 3b). Detailed analysis of the high-magnification high-resolution transmission electron microscopy (HRTEM) image exhibits continuous single directional lattice fringes with interplanar distance of about 0.23 nm (Figure 3b), which corresponds to the [111] lattice plane.42,43 Energy-dispersive X-ray spectroscopy (EDX) analysis of ThC-AgNPs was also carried out, and it shows the presence of Ag0 and other elements present in ThC (Figure 3c).
Figure 1.

UV–vis spectra of ThC (green line) and ThC-AgNPs (blue line) showing characteristic peaks of ThC at 278 nm and SPR band at 432 nm.
Figure 2.

Powder XRD pattern of ThC-AgNPs (blue line) and ThC (brown line) showing the presence of ThC on ThC-AgNPs.
Figure 3.

HRTEM images of (a) ThC-AgNPs, synthesized with the aid of sunlight and (b) interplanar distance of the fringes of ThC-AgNPs; (c) EDX pattern of ThC-AgNPs; (d, e) ThC-AgNPs after addition of mercury; and (f) EDX pattern of ThC-AgNPs after addition of mercury.
Metal-Ion Sensing Study with ThC-AgNPs
To investigate the metal-ion sensing property of ThC-AgNPs, they were allowed to interact with metal ions such as Li+, Na+, K+, Cs+, Ca2+, Mg2+, Ba2+, Cr3+, Sr2+, Co2+, Ni2+, Cd2+, Zn2+, Rb+, Hg2+, Pb2+, and Cu2+ in aqueous media following the procedure described in Experimental Section. The interaction with metal ions was followed by UV–vis spectroscopy, and the spectral change upon addition of metal ions is compared to that obtained without addition of any metal ion, as shown in Figure 4. It may be noted in the figure that only for Hg2+, the SPR band disappeared with distinct color change from yellow to colorless, as shown in the inset of Figure 4. For other metal ions used in this study, no significant spectral change or considerable color change is noted. The result therefore suggests that ThC-AgNPs function as a selective colorimetric sensor for Hg2+ in aqueous media. In the detection process, the possible interference from other metal ions has also been examined using mixture of metal ions following the procedure described in Experimental Section. The UV–vis spectral change upon addition of mixture of metal ions is shown in Figure S7 (Supporting Information), and the bar diagram showing the change in absorbance (432 nm) against mixture of metal ions is shown in Figure 5. The bar diagram clearly shows that there is no interference from any other metal ions used in this study.
Figure 4.

UV–vis spectral change for ThC-AgNPs (1 mL stock solution) recorded after 2 m upon addition of different metal ions (1 mL, 2 mM). Inset: color of the solution of ThC-AgNPs after addition of metal ions (color change is noted only for Hg2+).
Figure 5.

Bar diagram showing the change in the intensity of the absorption band of ThC-AgNPs (1.0 mL of stock solution) at 432 nm (SPR) recorded after 2 m upon addition of 0.5 mL (0.5 mM) of mercury and 0.5 mL (5.0 mM) of other metal ions.
Mechanistic Aspects of Hg2+ Sensing
It is well documented that sulfur interacts strongly with surface of the silver nanoparticles (Ag0);21,23 at the same time, Hg2+ forms a strong complex with sulfur atom as donor. In this case, ThC is designed incorporating thiophene at the lower rim of the calix unit with 1,3-alternate conformation so that calix moiety can anchor onto the surface of the nanoparticles through the sulfur atoms of the thiophene. There is no coordinating group/donor atom at the upper rim of the calix unit, which prevented it to achieve intermolecular interaction/aggregation through the upper rim, which promoted to form discrete calix-capped nanoparticles (Figure S8). For the same reason, the added Hg2+ could not interact through the free upper rim of the calixarene moieties forming network structure, resulting in aggregation of nanoparticles. It is also documented that metal-induced aggregation is expected to cause shift in SPR band with color change of the solution or a new SPR band is expected to appear;22 however, none of them is actually observed in this case. On the other hand, as the Hg2+ can form strong complex with the sulfur atom of the thiophene moiety, it can take away the calixarene molecules from the surface of the nanoparticles by complexation leaving nanoparticles with bare surface, which can aggregate and/or interact with free Hg2+ ions forming Ag–Hg amalgam. In such situation, the material no longer can behave as discrete nanoparticles, and therefore, the SPR band is expected to disappear, which is actually observed (Figures 4 and 5). The stripping of calixarene from the surface of the nanoparticles resulted in the formation of highly reactive bare AgNPs, which were then reacted with free Hg2+ to form Ag–Hg amalgam44,45 and also self-assembled by dipole–dipole interaction resulting in aggregation.46,47 This phenomenon is expected to change the size and shape of the nanoparticles.44−47 Experimentally, it has been noted that upon addition of incremental amount of Hg2+, the intensity of the SPR band diminishes and finally disappeared (Figure 6), which supports the proposed mechanism.48−50 The TEM image of ThC-AgNPs was recorded after addition of Hg2+, and the image is shown in Figure 3d,e. It may be noted that the particles are no longer in discrete spherical shape, and a close view shown in Figure 3e revealed that particles are assembled forming rodlike shape, loosing discrete nanoparticle nature, which is consistent with the observed disappearance of the SPR band. EDX analysis of the particles obtained after addition of Hg2+ into ThC-AgNPs, shown in Figure 3f, exhibits the presence of both Ag and Hg. The experimental data therefore suggest that the mechanism of detection involved displacement of ThC from the surface of the ThC-AgNPs because of the strong interaction of Hg2+ with the sulfur atoms of ThC, followed by the formation of Ag–Hg amalgam and AgNPs self-assembly by dipole–dipole interaction of the bare-surfaced nanoparticles, a schematic presentation of which is shown in Scheme 2.48−50 It may be noted that the EDX analysis after addition of Hg2+ (Figure 3f) exhibited the presence of a significant amount of (in %) carbon, nitrogen, oxygen, and sulfur, which suggests that the entire calixarene molecules from the surface of the nanoparticles were not completely removed, and the interaction with Hg2+ or dipole–dipole interaction takes place through the bare surface available for interaction.
Figure 6.

UV–vis spectral change for ThC-AgNPs (1 mL of stock solution) recorded after 2 m upon addition of incremental amount of Hg2+ (20–400 nM). (Inset: plot of the change in absorption intensity as a function of concentration of Hg2+ showing the linear behavior in the concentration range 20–900 nM (top) and the photographic image of the corresponding changes in color of ThC-AgNPs solution upon addition of Hg2+ in aqueous media (bottom)).
Scheme 2. Schematic Presentation Showing the Mechanistic Aspect of Hg2+ Sensing by ThC-AgNPs.

According to the proposed mechanism, the selectivity toward a particular metal ion depends on the competency through which the metal ion can remove the calixarene moiety from the surface of the nanoparticles making bare surface. It is well known that Hg2+ has strong affinity toward sulfur to form complex, and in the present case, Hg2+, among all other metal ions used in this study, exhibited strong ability under the experimental condition to form complex through the sulfur atom of the thiophene ring, displacing calixarene moiety from the surface of the nanoparticles. In support of this argument, an experiment was carried out in which solution of Hg(ClO4)2 was added into the methanolic solution of ThC, which resulted in immediate precipitate of the Hg2+ complex of ThC, suggesting that Hg2+ forms strong complex with the ThC. This is the main reason in this case to exhibit selective detection for Hg2+.
Effect of pH on Sensing of Hg2+
The effect of pH on the detection of Hg2+ has been examined, and details of the experimental procedure are in Experimental Section. The UV–vis spectral change upon addition of Hg2+ in the range of 2–10 is shown in Figure S9a, and a bar diagram showing the change in intensity of the SPR band (432 nm) as a function of pH is presented in Figure S9b. The figures show that the change in intensity of the SPR band in the presence of Hg2+ increases significantly from pH 2 to 7, while in the pH range of 8–10, the change is not significant, which can be attributed to the less solubility of the perchlorate salt of Hg2+ in that pH range. Therefore, ThC-AgNPs can be used for the detection and quantification of Hg2+ in the pH range of 2–7.
Spectrophotometric Titration for Detection of Hg2+ by ThC-AgNPs
UV–vis titration for the detection of Hg2+ was carried out following the method described in Experimental Section to find out the limit of detection (LOD) and also the concentration range, in which the plot exhibits linearity so that it can be used for estimation of Hg2+ in a solution of unknown concentration. The spectral change upon incremental addition of Hg2+ is shown in Figure 6, and the plot of change in absorption intensity (A0 – A) as a function of concentration of Hg2+ is shown in the inset. The plot shows a linear behavior in the Hg2+ concentration range of 20–0.9 nM, with a good linear correlation coefficient (R2) of 0.994. For the determination of LOD, the plot in the lower-concentration region of metal ion has expanded and is shown in Figure S10 (Supporting Information), from which the LOD found is 0.5 nM (0.1 ppb), which is lower than the permissible limit of Hg2+ in drinking water (10 nM, 2 ppb), according to the guidelines of the US-EPA and WHO.12 The LOD obtained is compared to some of the recently published LOD data obtained by colorimetric method using functionalized silver nanoparticles in aqueous media (Table 1). The LOD value of the present study is comparable to or better than many recently published data.
Table 1. LOD Value Obtained Is Compared with Some of the Recently Published Data Obtained by Colorimetric Method Using Functionalized Silver Nanoparticles in Aqueous Media.
| material used to functionalized AgNPs | metal ion detecteda | LOD (nM) | linear range (μM) | ref |
|---|---|---|---|---|
| VP and ILP | Hg2+** | 1000 | 1–10 | (51) |
| N-cholyl-lcysteine | Hg2+ | 8 | 0.005–0.2 | (52) |
| citrate | Hg2+ | 17 | 0.025–0.5 | (53) |
| glutamine and histidine | Hg2+ | 900 | 100–1000 | (54) |
| melamine | Hg2+*** | 1800 | 10–100 | (55) |
| trisodium citrate | Hg2+ | 3.3 | 0.01–0.5 | (49) |
| trisodium citrate | Hg2+ | 3 | 0.003–0.5 | (24) |
| cysteamine | Hg2+ | 0.273 | 0.0002–0.013 | (56) |
| extract of soap-root plant | Hg2+ | 2200 | 0–100 | (57) |
| calix[4]arene derivative | Hg2+ | 0.5 | 0.0003–0.01 | this study |
Metal ion other than Hg2+ detected: **Cd2+ and Pb2+; *** Cr3+.
Sensing of Hg0 in Solution and Vapor Phases
The ability of ThC-AgNPs for the detection of Hg0 in aqueous solution and in vapor phase has also been examined, following the method described in Experimental Section. The UV–vis spectral change for ThC-AgNPs in the presence of metallic mercury (Hg0) is shown in Figure 7, which exhibited that the SPR band at 432 nm disappeared and the color of the solution also changed (inset of Figure 7). For vapor phase, the experimental setup shown in Figure 8 clearly shows distinct change in color when metallic mercury is heated at 380 °C, suggesting that ThC-AgNPs can also interact with Hg0 in vapor phase.
Figure 7.

UV–vis spectra of ThC-AgNPs and the same recorded after 10 m upon addition of Hg0. Inset: color change of the solution of ThC-AgNPs upon addition of Hg0.
Figure 8.

Photographic image showing the experimental setup for sensing of Hg0 in vapor phase and color change for the ThC-AgNPs solution upon sensing of Hg0 vapor.
Amperometric Detection of Hg2+ in Water
The electrochemical behavior of ThC-AgNPs toward Hg2+ was studied by cyclic voltammetry (CV) and amperometry following the procedure described in Experimental Section. The cyclic voltammetry curves of ThC-AgNPs solution with incremental addition of Hg2+ and at different scan rate with fixed amount of Hg2+ in phosphate buffer solution (PBS) of pH 5.8 are shown in Figures S11 and S12 (Supporting Information). CV with incremental addition of Hg2+ exhibits a new cathodic peak at 0.92 V (Figure S11, Supporting Information), which is attributed to the reduction of Hg2+ to Hg22+, as shown below.45,58
The CV with gradual increment of scan rate exhibited shifts of oxidation peak toward positive potential and reduction peak toward negative potential (Figure S12, Supporting Information). The results suggest that this reaction follows the Randles–Sevcik equation, according to which the peak current is directly proportional to the square root of scan rate when other parameters are kept constant (Figure S13, Supporting Information) and thus the reaction is faradic in nature.59 The extrapolations of linear cathodic and anodic currents toward the y-axis meet almost at zero, suggesting that very low nonfaradic current is present in the system. The observation suggests that the interaction of Hg2+ with ThC-AgNPs is recognized by electrochemical response and it can be quantified by amperometric technique.
The amperometric i–t curve is continuously recorded by successive addition of Hg2+ separately in a homogenously stirred ThC-AgNPs solution in 0.1 M PBS (pH 5.8) with applied potential of −0.035 V. Dynamic stairs due to decrease in current on each addition of Hg2+ with time interval of 60 s is shown in Figure 9. Steady-state current is obtained in a few seconds, which promotes its applicability for the real-time sample analysis. Decrease in peak current is observed to be proportional to the concentration of Hg2+ in the range of 0.9–9 μM as shown in Figure 10. The detection limit calculated from Figure 10 is found to be 10 nM (2 ppb), which is on the basis of minimum concentration of Hg2+ required to decrease current.
Figure 9.

Amperometry of ThC-AgNPs on incremental addition of Hg2+ showing dynamic stairs due to decrease in current on each addition of Hg2+ with time interval of 60 s.
Figure 10.

Calibration plot of concentration Hg2+ versus current by dynamic stairs obtained during gradual addition of Hg2+ in ThC-AgNPs solution in PBS of pH 5.8. Inset: linear behavior of Hg2+ in the concentration range of 45–105 nM.
Analysis of Real Samples
The performance of ThC-AgNPs for detection of Hg2+ in water, as well as Hg0 in soil as real samples is checked. For Hg2+ in water, samples were collected from the institute’s tap water source and drinking water source, and these samples were analyzed for Hg2+ by inductively coupled plasma mass spectrometry; however, no Hg2+ was detected in these samples. These two samples were then spiked with a known amount of Hg2+ and were treated as unknown samples. These solutions were then added into the solution of ThC-AgNPs, and their UV–vis spectra were recorded after 2 min of addition. The difference in absorbance of the SPR band at 432 nm is used to determine the concentration of Hg2+, as shown in Figure 11, and the linear plot shown in Figure 6 is used. The amount of Hg2+ obtained and that added are given in Table 2, and the results are found to be satisfactory. It may be noted that not only Hg(ClO4)2 but also other ionic salts of Hg2+ can be determined using this method, as demonstrated in Figure S14 (Supporting Information).
Figure 11.

Determination of Hg2+ in spiked aqueous solution using the standard linear plot (from Figure 6).
Table 2. Estimation of Hg2+ Following the Method Developed in Tap and Drinking Water Samples Spiked with Hg(ClO4)2 and Percentage of Recovery.
| tap water | Hg2+ in spiked solution (μM) | Hg2+ estimated in spiked solution (μM) | recovery (%) |
|---|---|---|---|
| T1 | 0.20 | 0.26 | 130.00 |
| T2 | 0.70 | 0.67 | 95.71 |
| drinking water | |||
|---|---|---|---|
| D1 | 0.30 | 0.28 | 93.33 |
| D2 | 0.60 | 0.61 | 101.67 |
For detection of Hg0 in soil, a similar procedure is followed; however, quantitative detection is difficult as preparation of samples for analysis following spike method requires mixing of Hg metal and soil in solid phase, which is a heterogeneous mixture, and during the measurement, it is difficult to ensure 100% evaporation of Hg0 from the mixture and transfer of entire amount of Hg0 vapor produced into the solution of ThC-AgNPs. Eight sets of samples were prepared by mixing around 2–16 mg of Hg0 and 500 mg of soil, which was dried in vacuum overnight, and the samples were heated at 380 °C for 30 and 60 min and the UV–vis spectra of the ThC-AgNPs solution were recorded. The color change of the solution is shown in Figure 12, the UV–vis spectral change after 30 and 60 min, and the plots of absorbance change of the SPR band as a function of the amount of Hg0 added for both the temperatures are shown in Figures S15–S17 (Supporting Information). Detection of Hg0 vapor by ThC-AgNPs is evident from the color and absorption spectral changes with time and concentration; however, quantification using present data will not be accurate for the reason mentioned above, and weighing of submilligram (ppb, ppm) quantity of Hg metal itself is difficult. However, this is a good technique with high sensitivity for measurement of Hg0 in solid material such as soil, etc., and can be used for semiquantitative measurement.
Figure 12.

Detection of Hg metal in soil; around 2–16 mg of Hg metal is mixed with 500 mg of soil and heated at 380 °C; color of the ThC-AgNPs solution before heating and after 30 and 60 min of heating are shown (disappearance of color is due to sensing of Hg metal).
Conclusions
In summary, a s imple route for the synthesis of calixarene-functionalized silver nanoparticles (ThC-AgNPs) with the aid of sunlight is developed. The thiophene-substituted calixarene moiety (ThC) was anchored onto the surface of the AgNPs through the sulfur atoms of the thiophene moiety. The metal-ion sensing property of the ThC-AgNPs, investigated with a large number of metal ions with the aid of SPR absorption band, revealed that it detects Hg2+ with sharp color change and with high selectivity and sensitivity (LOD 0.5 nM) without interference from any other metal ions used in this study. ThC-AgNPs also detect Hg0 in solution and in vapor phase with sharp color change. Mechanistic study for the detection of Hg2+ revealed Hg2+ induced displacement of anchored ThC-AgNPs from the surface of the AgNPs, followed by formation of Ag–Hg amalgam and self-assembled array of AgNPs due to dipole–dipole interaction of the bare-surfaced nanoparticles. Hg2+ has also been detected by electrochemical study using amperometric technique with high sensitivity (LOD, 10 nM). The new material is used to detect Hg2+ in aqueous real sample and Hg0 in soil sample.
Materials and Methods
Materials
All chemicals were of analytical grade and were used without further purification. p-tert-Butyl phenol and NAOH were purchased from SRL; formaldehyde was purchased from labort chemicals; anhydrous AlCl3 was purchased from Spectrochem; methyl bromoacetate was purchased from Merck; hydrazine hydrate and 3-thiophene acetic acid were purchased from TCI; and AgNO3 was purchased from S. D. Fine Chemicals. Perchlorate salts of different metal ions were purchased from Sigma-Aldrich. All organic solvents were of AR grade and were purchased from Fisher Scientific.
Methods
NMR spectra were recorded on Avance II 500 Bruker FT-NMR instrument, mass spectra were recorded on Q-TOF MicroTM liquid chromatography–mass spectrometry (LC–MS) instrument, Fourier transform infrared spectra were recorded on Agilent Technologies Cary 600 series IR spectrometer, and elemental analysis was carried out on Elementar Vario MICRO cube analyzer. Powder XRD pattern was recorded on a PANalytical Empyrean Series 2 X-ray diffraction system. HRTEM images were recorded on a JEOL JEM-2100 transmission electron microscope. UV–vis spectra were recorded with Varian-500 spectrometer. All of the electrochemical measurements were carried out on the Metrohm Autolab 203 potentiostat/galvanostat instrument.
Synthesis of Ligand
The starting and intermediate compounds, p-tertiarybutyl calix[4]arene,60 calix[4]arene,61 1,3-o-dimethyl ester calix[4]arene derivative,62 and 1,3-o-hydrazine calix[4]arene derivative,63 were synthesized following the reported procedure.
Synthesis of Thiophene-Substituted Calix[4]arene Derivative (ThC)
The compound 1,3-o-hydrazine calix[4]arene was reacted with 3-thiophene acetic acid and EDC·HCl to synthesize thiophene-substituted calix[4]arene (ThC). In a typical procedure, 3-thiophene acetic acid (800.6 mg, 5.6 mM) dissolved in dry acetonitrile (50 mL) was added to EDC·HCl (2.0 g, excess), and the reaction mixture was stirred at room temperature under nitrogen for 15 min. This solution was then added into 1,3-o-hydrazine calix[4]arene (800 mg, 1.40 mM) dissolved in dry acetonitrile (150 mL), and the reaction mixture was stirrred at room temperature under nitrogen atmosphere for 24 h. During stirring, a white precipitate separated, which was then collected by filtration and washed three times with Milli-Q water (50 mL) to remove excess EDC·HCl and 3-thiophene acetic acid, if any. The white product was then dried under vacuum overnight in yield of 58%.
Characterization Data
IR, νmax (KBr pellet)/cm–1 3385 cm–1 (−NH); 1674 cm–1 (−CONH). 1H NMR (500 MHz, CD3CN): δ 10.22 (s, 2H, −CONH); δ 9.03 (s, 2H, −NHCO); δ 8.09 (s, 2H, −OH); δ 7.36 (d, 2H, −C=CH(5)–S−); δ 7.28 (s, 2H, −S–CH(2)–C); δ 7.18 (d, 4H, Ar-Hm); δ 7.10 (d, 2H, −C–CH(4)=CH2); δ 7.06 (d, 4H, Ar-Hm); δ 6.89 (t, 4H, Ar-Hp); δ 6.75 (t, 4H, Ar-Hp); δ 4.69 (s, 4H, −OCH2CO); δ 4.23 (d, 4H, Ar-CH2-Ar), δ 3.64 (s, 4H, −CH=C–CH2−), δ 3.54 (d, 4H, Ar-CH2-Ar). ES-MS (m/z): found 815.22, calcd for [ThC-H]+, 816.23. Anal. calcd for C44H40N4O8S2: C, 64.69; H, 4.94; N, 6.86; S, 7.85; found: C, 64.39; H, 5.15; N, 7.02; S, 7.71.
Synthesis of Silver Nanoparticles (ThC-AgNPs)
Silver nanoparticles were synthesized using ThC as stabilizing agent. In a typical procedure, ThC (4.8 mg), dissolved in 1.0 mL of methanol, was added into the aqueous (100 mL) silver nitrate (15.2 mg) solution with a AgNO3/ThC molar ratio of 1:15, and the reaction mixture was stirred in 1% (v/v) methanol/water for 2 min to mix it well. The reaction mixture was then exposed to sunlight for 35 min, during which the colorless solution became yellow. The solution was then kept at room temperature for half an hour and then stored at 4 °C for further use. To check the effect of temperature during preparation of nanoparticles, preparation was carried out under sunlight (with normal temperature under sunlight) at 50 and 80 °C. It is observed that under all of these three experimental conditions, nanoparticles were formed with almost equal efficiency, and there is only a few nanometers difference in absorption maxima (SPR band maxima at 432, 438, and 440 nM), which is probably due to slight differences in particles size. Details of the experimental setup and absorption spectra are shown in Figure S1 (Supporting Information).
Characterization
IR, νmax (KBr pellet)/cm–1 3426 cm–1 (−NH); 1638 cm–1 (−CONH). Powder XRD, 2θ (5–80), peaks at 2θ values of 38.13, 44.23, 64.43, and 77.46° (corresponding to the 111, 200, 220, and 311 planes of face-centered cubic silver, with JCPDS no: 04-014-0266). UV–vis, νmax 432 nm.
Metal-Ion Sensing Study
The performance of ThC-AgNPs toward sensing of metal ions was investigated with the aid of UV–vis spectroscopy. For this purpose, stock solution of ThC-AgNPs and aqueous solutions of the perchlorate salts of the metal ions (2 mM), Cu2+, Li+, K+, Na+, Cs2+, Ba2+, Ca2+, Mg2+, Cr3+, Sr2+, Co2+, Zn2+, Rb+, Ni2+, Cd2+, Hg2+, Pb2+ were used. In a typical experiment, 1 mL solution of the ThC-AgNPs was taken in a cuvette and 1 mL solution of a particular metal ion was added into it and the UV–vis spectra of the resulting solution were recorded. The experiment was repeated for every metal ion investigated. The UV–vis spectra of ThC-AgNPs with and without metal ions were then compared to measure the sensing property of the calixarene-modified silver nanoparticles.
UV–Vis Titration with Hg2+ Ion
The study on metal-ion sensing revealed that ThC-AgNPs selectively interact with Hg2+ ion, which prompted us to conduct UV–vis titration to find out the limit of detection (LOD) and also the concentration ranges of the metal ion, in which the plot, ratio of absorbance as a function of concentration of metal ion, exhibits linearity to use it for the estimation of Hg2+ of the solution of unknown concentration. For this titration, the same stock solution of ThC-AgNPs, as mentioned earlier, was used and the solution of the perchlorate salt of the Hg2+ was diluted appropriately to obtain the concentration of 0.04–800 nM. Then, 1 mL of each solution of metal ion was added into the solution of ThC-AgNPs (1 mL) in a 2 mL volumetric flask to make effective concentration of metal ion in the solution 0.02–400 nM and UV–vis spectra of all of the reaction mixtures were recorded.
Interference Study
To investigate the interference of other metal ions for selective detection of Hg2+, competitive binding property of ThC-AgNPs was examined with mixtures of Hg2+ and other metal ions used in this study. In a typical experiment, 1 mL of ThC-AgNPs stock solution was taken in a spectrophotometric cuvette and 1 mL of a mixture of metal ions containing Hg2+ and 10 times excess of Hg2+ of a competitive metal ion such as Li+, Na+, K+, Cs+, Ca2+, Mg2+, Ba2+, Cr3+, Co2+, Ni2+, Cd2+, Rb+, Sr2+, Pb2+, Cu2+, and Zn2+ were added into the cuvette and UV–vis spectra of the reaction mixture were recorded. The changes in the absorbance intensity of the SPR band of ThC-AgNPs (432 nm) were then plotted against mixtures of metal ions.
Sensing of Hg0 in Solution and Vapor Phases
Sensing of Hg0 in solution and vapor phases was investigated using ThC-AgNPs. In a typical procedure of sensing, mercury metal (Hg0, 1 gm) was added into a 2 mL solution of ThC-AgNPs, and within 10 min, the color of the solution disappeared and then UV–vis spectra of the solution were recorded. For sensing in vapor phase, mercury metal (Hg0, 200 mg) was filled in a glass vial and capped with a tube of polypropylene containing 2.0 mL of ThC-AgNPs. The glass vial filled with Hg0 was then heated at 380 °C, which produces Hg0 vapor, which was then allowed to pass through the neck of the glass vial and thus the vapor came in contact with ThC-AgNPs solution filled in polypropylene tube. The color of the solution changed from yellow to colorless, indicating detection of Hg0 in vapor phase.
Warning
Hg vapor is highly toxic, and it can damage the respiratory system. Therefore, experiment must be carried out with adequate precaution.
Sensing of Hg2+ at Different pH
Sensing of Hg2+ using ThC-AgNPs at various pH values ranging from 2 to 10 has also been carried out. In a typical experiment, stock solution of perchlorate salt of Hg2+ (2 mM) was prepared in different pH in the range of 2–10, adjusted by either HCl or NaOH in water. ThC-AgNPs (1 mL) were treated with the Hg2+ (1 mL, 2 mM) solutions of different pH, and after 2 min of addition, UV–vis spectra of the reaction mixtures were recorded.
Sensing of Hg2+ by Electrochemical Method
Detection of Hg2+ in aqueous media was also examined by cyclic voltammetry and amperometry in 0.1 M PBS (pH 5.8) at ambient temperature. For this purpose, a conventional three-electrode system consisting of Pt wire as working and counter electrodes and Ag/AgCl in saturated KCl solution as reference electrode was used. Before using the working and reference electrodes, platinum wires were dipped in chromic acid solution to remove any kind of impurities deposited on it. Electrodes were used without any coating and modification. ThC-AgNPs, after 50% dilution with 0.1 M PBS (pH 5.8) and Hg2+ of 0.1 mM in 0.1 M PBS (pH 5.8), were used as a stock solution for all electrochemical experiments. Cyclic voltammetry (CV) was recorded at a scan rate of 50 mV s–1 in the range of −1.2 to 1.2 V unless otherwise mentioned. All potentials were measured vs Ag/AgCl (sat. KCl). CV of ThC-AgNPs (20 mL) solution was recorded before and after incremental addition of 200 mL of Hg2+ solution with the same parameter mentioned above. Electrochemical reaction in solution was assessed by measuring cyclic voltammetry of ThC-AgNPs (20 mL) with fixed concentration of Hg2+ (2000 mL, 0.1 mM) at different scan rates from 50 to 500 mV s–1. The observations of scan rate study demonstrated increase of current at the potential 0.035 V and shift with increase of scan rate toward −0.2 V. Amperometric measurement with ThC-AgNPs (20 mL) solution was carried out at the same potential on successive addition of 200 mL of Hg2+ (0.1 mM) with regular time interval of 60 s.
Acknowledgments
CSIR-CSMCRI manuscript number 186/2018. P.P. gratefully acknowledges financial assistance in the form of CSIR-Emeritus Scientist Scheme. G.V. and S.B. acknowledge CSIR for awarding Senior Research Fellowship (SRF). The authors thank Dr D. N. Srivastava and A. Paul for assistance in electrochemical study. They also thank Dr V. Boricha, G. R. Bhadu, Dr A. K. Bhatt, A. K. Das, V. Agrawal, and V. Vakani for recording NMR, TEM, powder XRD, LC–MS, IR spectra, and elemental analysis, respectively.
Supporting Information Available
The Supporting Information is available free of charge on the ACS Publications website at DOI: 10.1021/acsomega.8b03299.
Experimental setup for preparation of nanoparticles under sunlight; schematic presentation of ThC-AgNPs; UV–vis, mass, IR, and NMR spectra for characterization of compounds; selectivity and interference studies; LOD calculation; pH study; electrochemical study; etc. (Figures S1–S17) (PDF)
The authors declare no competing financial interest.
Supplementary Material
References
- Ariya P. A.; Amyot M.; Dastoor A.; Deeds D.; Feinberg A.; Kos G.; Poulain A.; Ryjkov A.; Semeniuk K.; Subir M.; Toyota K. Mercury Physicochemical and Biogeochemical Transformation in the Atmosphere and at Atmospheric Interfaces: A Review and Future Directions. Chem. Rev. 2015, 115, 3760–3802. 10.1021/cr500667e. [DOI] [PubMed] [Google Scholar]
- Tchounwou P. B.; Yedjou C. G.; Patlolla A. K.; Sutton D. J.. Heavy Metal Toxicity and the Environment. In Molecular, Clinical and Environmental Toxicology; Luch A., Ed.; Springer: Basel, 2012; Vol. 101, pp 133–164. [DOI] [PMC free article] [PubMed] [Google Scholar]
- Chen G.; Guo Z.; Zeng G.; Tang L. Fluorescent and colorimetric sensors for environmental mercury detection. Analyst 2015, 140, 5400–5443. 10.1039/C5AN00389J. [DOI] [PubMed] [Google Scholar]
- Kim K.-H.; Kabir E.; Jahan S. A. A review on the distribution of Hg in the environment and its human health impacts. J. Hazard. Mater. 2016, 306, 376–385. 10.1016/j.jhazmat.2015.11.031. [DOI] [PubMed] [Google Scholar]
- De Barros Santos E.; Moher P.; Ferlin S.; Fostier A. H.; Mazali I. O.; Telmer K.; Brolo A. G. Proof of Concept for a Passive Sampler for Monitoring of Gaseous Elemental Mercury in Artisanal Gold Mining. Sci. Rep. 2017, 7, 16513 10.1038/s41598-017-16713-7. [DOI] [PMC free article] [PubMed] [Google Scholar]
- Adler Miserendino R.; Guimaraes J. R. D.; Schudel G.; Ghosh S.; Godoy J. M.; Silbergeld E. K.; Lees P. S. J.; Bergquist B. A. Mercury Pollution in Amapa, Brazil: Mercury Amalgamation in Artisanal and Small-Scale Gold Mining or Land-Cover and Land-Use Changes?. ACS Earth Space Chem. 2018, 2, 441–450. 10.1021/acsearthspacechem.7b00089. [DOI] [Google Scholar]
- Wendroff A. P. The Toxicology of Mercury. N. Engl. J. Med. 2004, 350, 945–947. 10.1056/NEJM200402263500919. [DOI] [PubMed] [Google Scholar]
- Li J.; Yao J.; Zhong W. Membrane blotting for rapid detection of mercury(II) in water. Chem. Commun. 2009, 4962–4964. 10.1039/b910251e. [DOI] [PubMed] [Google Scholar]
- Chun H. J.; Kim S.; Han Y. D.; Kim D. W.; Kim K. R.; Kim H.-S.; Kim J.-H.; Yoon H. C. Water-Soluble Mercury Ion Sensing Based on the Thymine-Hg2+-Thymine Base Pair Using Retroreflective Janus Particle as an Optical Signaling Probe. Biosens. Bioelectron. 2018, 104, 138–144. 10.1016/j.bios.2018.01.008. [DOI] [PubMed] [Google Scholar]
- Harada M. Minamata Disease: Methylmercury Poisoning in Japan Caused by Environmental Pollution. Crit. Rev. Toxicol. 1995, 25, 1–24. 10.3109/10408449509089885. [DOI] [PubMed] [Google Scholar]
- Tan S. W.; Meiller J. C.; Mahaffey K. R. The endocrine effects of mercury in humans and wildlife. Crit. Rev. Toxicol. 2009, 39, 228–269. 10.1080/10408440802233259. [DOI] [PubMed] [Google Scholar]
- U.S. EPA . Edition of the Drinking Water Standards and Health Advisories Tables; Office of Water, U.S. Environmental Protection Agency: Washington, DC, 2018. [Google Scholar]
- Zhu X.; Alexandratos S. D. Determination of trace levels of mercury in aqueous solutions by inductively coupled plasma atomic emission spectrometry: Elimination of the ‘memory effect’. Microchem. J. 2007, 86, 37–41. 10.1016/j.microc.2006.09.004. [DOI] [Google Scholar]
- Martinis E. M.; Berton P.; Olsina R. A.; Altamirano J. C.; Wuilloud R. G. Trace Mercury Determination in Drinking and Natural Water Samples by Room Temperature Ionic Liquid Based-Preconcentration and Flow Injection-Cold Vapor Atomic Absorption Spectrometry. J Hazard. Mater. 2009, 167, 475–481. 10.1016/j.jhazmat.2009.01.007. [DOI] [PubMed] [Google Scholar]
- Bagheri H.; Naderi M. Immersed Single-Drop Microextraction-Electrothermal Vaporization Atomic Absorption Spectroscopy for the Trace Determination of Mercury in Water Samples. J Hazard. Mater. 2009, 165, 353–358. 10.1016/j.jhazmat.2008.09.128. [DOI] [PubMed] [Google Scholar]
- Vyas G.; Kumar A.; Bhatt M.; Bhatt S.; Paul P. New Route for Synthesis of Fluorescent SnO2 Nanoparticles for Selective Sensing of Fe(III) in Aqueous Media. J. Nanosci. Nanotechnol. 2018, 18, 3954–3959. 10.1166/jnn.2018.15025. [DOI] [PubMed] [Google Scholar]
- Bhatt S.; Bhatt M.; Kumar A.; Vyas G.; Gajaria T.; Paul P. Green route for synthesis of multifunctional fluorescent carbon dots from Tulsi leaves and its application as Cr(VI) sensors, bio-imaging and patterning agents. Colloids Surf. B 2018, 167, 126–133. 10.1016/j.colsurfb.2018.04.008. [DOI] [PubMed] [Google Scholar]
- Adil L. R.; Gopikrishna P.; Iyer P. K. Receptor-Free Detection of Picric Acid: A New Structural Approach for Designing Aggregation-Induced Emission Probes. ACS Appl. Mater. Interfaces 2018, 10, 27260–27268. 10.1021/acsami.8b07019. [DOI] [PubMed] [Google Scholar]
- Hussain S.; De S.; Iyer P. K. Thiazole-Containing Conjugated Polymer as a Visual and Fluorometric Sensor for Iodide and Mercury. ACS Appl. Mater. Interfaces 2013, 5, 2234–2240. 10.1021/am400123j. [DOI] [PubMed] [Google Scholar]
- Kaur B.; Kaur N.; Kumar S. Colorimetric Metal Ion Sensors—A Comprehensive Review of the Years 2011–2016. Coord. Chem. Rev. 2018, 358, 13–69. 10.1016/j.ccr.2017.12.002. [DOI] [Google Scholar]
- Maity D.; Gupta R.; Gunupuru R.; Srivastava D. N.; Paul P. Calix [4] arene functionalized gold nanoparticles: Application in colorimetric and electrochemical sensing of cobalt ion in organic and aqueous medium. Sens. Actuators, B 2014, 191, 757–764. 10.1016/j.snb.2013.10.066. [DOI] [Google Scholar]
- Chaudhary J. P.; Kumar A.; Paul P.; Meena R. Carboxymethylagarose-AuNPs generated through green route for selective detection of Hg2+ in aqueous medium with a blue shift. Carbohydr. Polym. 2015, 117, 537–542. 10.1016/j.carbpol.2014.10.016. [DOI] [PubMed] [Google Scholar]
- Maity D.; Kumar A.; Gunupuru R.; Paul P. Colorimetric detection of mercury(II) in aqueous media with high selectivity using calixarene functionalized gold nanoparticles. Colloids Surf., A 2014, 455, 122–128. 10.1016/j.colsurfa.2014.04.047. [DOI] [Google Scholar]
- Chen N.; Zhang Y.; Liu H.; Wu X.; Li Y.; Miao L.; Shen Z.; Wu A. High-Performance Colorimetric Detection of Hg2+ Based on Triangular Silver Nanoprisms. ACS Sens. 2016, 1, 521–527. 10.1021/acssensors.6b00001. [DOI] [Google Scholar]
- Masawat P.; Harfield A.; Srihirun N.; Namwong A. Green Determination of Total Iron in Water by Digital Image Colorimetry. Anal Lett. 2017, 50, 173–185. 10.1080/00032719.2016.1174869. [DOI] [Google Scholar]
- Firdaus M. L.; Fitriani I.; Wyantuti S.; Hartati Y. W.; Khaydarov R.; Mcalister J. A.; Obata H.; Gamo T. Colorimetric Detection of Mercury(II) Ion in Aqueous Solution Using Silver Nanoparticles. Anal. Sci. 2017, 33, 831–837. 10.2116/analsci.33.831. [DOI] [PubMed] [Google Scholar]
- Zamborini F. P.; Bao L.; Dasari R. Nano particles in measurement Science. Anal. Chem. 2012, 84, 541–576. 10.1021/ac203233q. [DOI] [PubMed] [Google Scholar]
- Khan U.; Niaz A.; Shah A.; Zaman M. I.; Zia M. A.; Iftikhar F. J.; Nisar J.; Ahmed M. N.; Akhter M. S.; Shah A. H. Thiamine-Functionalized Silver Nanoparticles for the Highly Selective and Sensitive Colorimetric Detection of Hg2+ Ions. New J. Chem. 2018, 42, 528–534. 10.1039/C7NJ03382F. [DOI] [Google Scholar]
- Kumar A.; Paul P. Gold nanoparticles for design of smart colorimetric logic gates operations and scavengers for mercury ions in water. Anal. Methods 2014, 6, 4551–4558. 10.1039/c4ay00914b. [DOI] [Google Scholar]
- Kumar A.; Bhatt M.; Vyas G.; Bhatt S.; Paul P. Sunlight Induced Preparation of Functionalized Gold Nanoparticles as Recyclable Colorimetric Dual Sensor for Aluminium and Fluoride in Water. ACS Appl. Mater. Interfaces 2017, 9, 17359–17368. 10.1021/acsami.7b02742. [DOI] [PubMed] [Google Scholar]
- Ray P. C. Size and Shape Dependent Second Order Nonlinear Optical Properties of Nanomaterials and Their Application in Biological and Chemical Sensing. Chem. Rev. 2010, 110, 5332–5365. 10.1021/cr900335q. [DOI] [PMC free article] [PubMed] [Google Scholar]
- Lee K.-S.; El-Sayed M. A. Gold and Silver Nanoparticles in Sensing and Imaging: Sensitivity of Plasmon Response to Size, Shape, and Metal Composition. J. Phys. Chem. B 2006, 110, 19220–19225. 10.1021/jp062536y. [DOI] [PubMed] [Google Scholar]
- Uttam B.; Hussain M. A.; Joshi S.; Rao C. P. Physicochemical and Ion-sensing properties of benzofurazanappended Calix[4]arene in Solution and on gold nanoparticles: spectroscopy, microscopy, and DFT computations in support of the species of recognition. ACS Omega 2018, 3, 16989–16999. 10.1021/acsomega.8b02848. [DOI] [PMC free article] [PubMed] [Google Scholar]
- Phan C. M.; Nguyen H. M. Role of Capping Agent in Wet Synthesis of Nanoparticles. J. Phys. Chem. A 2017, 121, 3213–3219. 10.1021/acs.jpca.7b02186. [DOI] [PubMed] [Google Scholar]
- Zhou J.; Ralston J.; Sedev R.; Beattie D. A. Functionalized Gold Nanoparticles: Synthesis, Structure and Colloid Stability. J. Colloid Interface Sci. 2009, 331, 251–262. 10.1016/j.jcis.2008.12.002. [DOI] [PubMed] [Google Scholar]
- Joseph R.; Rao C. P. Ion and molecular recognition by lower rim 1,3-di-conjugates of calix[4]arene a receptors. Chem. Rev. 2011, 111, 4658–4702. 10.1021/cr1004524. [DOI] [PubMed] [Google Scholar]
- Wang N.; Lin M.; Dai H.; Ma H. Functionalized Gold Nanoparticles/Reduced Graphene Oxide Nanocomposites for Ultrasensitive Electrochemical Sensing of Mercury Ions Based on Thymine-Mercury-Thymine Structure. Biosens. Bioelectron. 2016, 79, 320–326. 10.1016/j.bios.2015.12.056. [DOI] [PubMed] [Google Scholar]
- Xie H.; Wang Q.; Chai Y.; Yuan Y.; Yuan R. Enzyme-Assisted Cycling Amplification and DNA-Templated in-Situ Deposition of Silver Nanoparticles for the Sensitive Electrochemical Detection of Hg2+. Biosens. Bioelectron. 2016, 86, 630–635. 10.1016/j.bios.2016.07.035. [DOI] [PubMed] [Google Scholar]
- Patra S.; Gunupuru R.; Lo R.; Suresh E.; Ganguly B.; Paul P. Cation-Induced Fluorescent Excimer Emission in Calix[4]Arene-Chemosensors Bearing Quinoline as a Fluorogenic Unit: Experimental, Molecular Modeling and Crystallographic Studies. New J. Chem. 2012, 36, 988–1002. 10.1039/c2nj20904g. [DOI] [Google Scholar]
- Wu T.; Wang L.; Zhang Y.; Du S.; Guo W.; Pei M. Electrochemical Synthesis of Poly(3-Thiophene Acetic Acid) Nanowires with Water-Soluble Macromolecule Templates. RSC Adv. 2015, 5, 16684–16690. 10.1039/C4RA17078D. [DOI] [Google Scholar]
- Matthews S. E.; Cecioni S.; O’Brien J. E.; MacDonald C. J.; Hughes D. L.; Jones G. A.; Ashworth S. H.; Vidal S. Fixing the Conformation of Calix[4]Arenes: When Are Three Carbons Not Enough?. Chem. - Eur. J. 2018, 24, 4436–4444. 10.1002/chem.201705955. [DOI] [PubMed] [Google Scholar]
- Shen H.; Duan C.; Guo J.; Zhao N.; Xu J. Facile in Situ Synthesis of Silver Nanoparticles on Boron Nitride Nanosheets with Enhanced Catalytic Performance. J. Mater. Chem. A 2015, 3, 16663–16669. 10.1039/C5TA04188K. [DOI] [Google Scholar]
- Liu S.; Sun B.; Li J.-G.; Chen J. Silver Nanowires with Rounded Ends: Ammonium Carbonate-Mediated Polyol Synthesis, Shape Evolution and Growth Mechanism. CrystEngComm 2014, 16, 244–251. 10.1039/C3CE41738G. [DOI] [Google Scholar]
- Wang G.-L.; Zhu X.-Y.; Jiao H.-J.; Dong Y.-M.; Li Z.-J. Ultrasensitive and dual functional colorimetric sensors for mercury(II) ions and hydrogen peroxide based on catalytic reduction property of silver nanoparticles. Biosens. Bioelectron. 2012, 31, 337–342. 10.1016/j.bios.2011.10.041. [DOI] [PubMed] [Google Scholar]
- Ramesh G. V.; Radhakrishnan T. P. A Universal Sensor for Mercury (Hg, HgI, HgII) Based on Silver Nanoparticle-Embedded Polymer Thin Film. ACS Appl. Mater. Interfaces 2011, 3, 988–994. 10.1021/am200023w. [DOI] [PubMed] [Google Scholar]
- Malynych S.; Chumanov G. Light-Induced Coherent Interactions between Silver Nanoparticles in Two-Dimensional Arrays. J. Am. Chem. Soc. 2003, 125, 2896–2898. 10.1021/ja029453p. [DOI] [PubMed] [Google Scholar]
- Atay T.; Song J.-H.; Nurmikko A. V. Strongly Interacting Plasmon Nanoparticle Pairs: From Dipole–Dipole Interaction to Conductively Coupled Regime. Nano Lett. 2004, 4, 1627–1631. 10.1021/nl049215n. [DOI] [Google Scholar]
- Alam M. N.; Chatterjee A.; Das S.; Batuta S.; Mandal D.; Begum N. A. Burmese Grape Fruit Juice Can Trigger the “Logic Gate”-like Colorimetric Sensing Behavior of Ag Nanoparticles towards Toxic Metal Ions. RSC Adv. 2015, 5, 23419–23430. 10.1039/C4RA16984K. [DOI] [Google Scholar]
- Chen L.; Fu X.; Lu W.; Chen L. Highly Sensitive and Selective Colorimetric Sensing of Hg2+ Based on the Morphology Transition of Silver Nanoprisms. ACS Appl. Mater. Interfaces 2013, 5, 284–290. 10.1021/am3020857. [DOI] [PubMed] [Google Scholar]
- Henglein A.; Brancewicz C. Absorption Spectra and Reactions of Colloidal Bimetallic Nanoparticles Containing Mercury. Chem. Mater. 1997, 9, 2164–2167. 10.1021/cm970258x. [DOI] [Google Scholar]
- Kumar V. V.; Anthony S. P. Silver nanoparticles based selective colorimetric sensor for Cd2+, Hg2+ and Pb2+ ions: Tuning sensitivity and selectivity using co-stabilizing agents. Sens. Actuators, B 2014, 191, 31–36. 10.1016/j.snb.2013.09.089. [DOI] [Google Scholar]
- Annadhasan M.; Rajendiran N. Highly selective and sensitive colorimetric detection of Hg(II) ions using green synthesized silver nanoparticles. RSC Adv. 2015, 5, 94513–94518. 10.1039/C5RA18106B. [DOI] [Google Scholar]
- Wang Y.; Yang F.; Yang X. Colorimetric Detection of Mercury(II) Ion Using Unmodified Silver Nanoparticles and Mercury-Specific Oligonucleotides. ACS Appl. Mater. Interfaces 2010, 2, 339–342. 10.1021/am9007243. [DOI] [PubMed] [Google Scholar]
- Buduru P.; Reddy B. C. S. R.; Naidu N. V. S. Functionalization of silver nanoparticles with glutamine and histidine for simple and selective detection of Hg2+ ion in water samples. Sens. Actuators, B 2017, 244, 972–982. 10.1016/j.snb.2017.01.041. [DOI] [Google Scholar]
- Kailasa S. K.; Chandel M.; Mehta V. N.; Park T. J. Influence of ligand chemistry on silver nanoparticles for colorimetric detection of Cr3+ and Hg2+ ions. Spectrochim. Acta, Part A 2018, 195, 120–127. 10.1016/j.saa.2018.01.038. [DOI] [PubMed] [Google Scholar]
- Bhattacharjee Y.; Chakraborty A. Label-Free Cysteamine-Capped Silver Nanoparticle-Based Colorimetric Assay for Hg(II) Detection in Water with Subnanomolar Exactitude. ACS Sustainable Chem. Eng. 2014, 2, 2149–2154. 10.1021/sc500339n. [DOI] [Google Scholar]
- Farhadi K.; Forough M.; Molaei R.; Hajizadeh S.; Rafipour A. Highly selective Hg2+ colorimetric sensor using green synthesized and unmodified silver nanoparticles. Sens. Actuators, B 2012, 161, 880–885. 10.1016/j.snb.2011.11.052. [DOI] [Google Scholar]
- Marenco A. J.; Pedersen D. B.; Wang S.; Petryk M. W. P.; Kraatz H.-B. Electrochemical Properties of Gas-Generated Silver Nanoparticles in the Presence of Cyano- and Chloride-Containing Compounds. Analyst 2009, 134, 2021–2027. 10.1039/b909748a. [DOI] [PubMed] [Google Scholar]
- Gau V.; Ma S.-C.; Wang H.; Tsukuda J.; Kibler J.; Haake D. A. Electrochemical Molecular Analysis without Nucleic Acid Amplification. Methods 2005, 37, 73–83. 10.1016/j.ymeth.2005.05.008. [DOI] [PMC free article] [PubMed] [Google Scholar]
- Gutsche C. D.; Levine J. A. Calixarenes. 6. Synthesis of a Functionalizable Calix[4]Arene in a Conformationally Rigid Cone Conformation. J. Am. Chem. Soc. 1982, 104, 2652–2653. 10.1021/ja00373a060. [DOI] [Google Scholar]
- Gutsche C. D.; Levine J. A.; Sujeeth P. K. Calixarenes. 17. Functionalized Calixarenes: The Claisen Rearrangement Route. J. Org. Chem. 1985, 50, 5802–5806. 10.1021/jo00350a072. [DOI] [Google Scholar]
- Unob F.; Asfari Z.; Vicens J. An Anthracene-Based Fluorescent Sensor for Transition Metal Ions Derived From Calix[4]Arene. Tetrahedron Lett. 1998, 39, 2951–2954. 10.1016/S0040-4039(98)00376-1. [DOI] [Google Scholar]
- Quinlan E.; Matthews S. E.; Gunnlaugsson T. Colorimetric Recognition of Anions Using Preorganized Tetra-Amidourea Derived Calix[4]Arene Sensors. J. Org. Chem. 2007, 72, 7497–7503. 10.1021/jo070439a. [DOI] [PubMed] [Google Scholar]
Associated Data
This section collects any data citations, data availability statements, or supplementary materials included in this article.