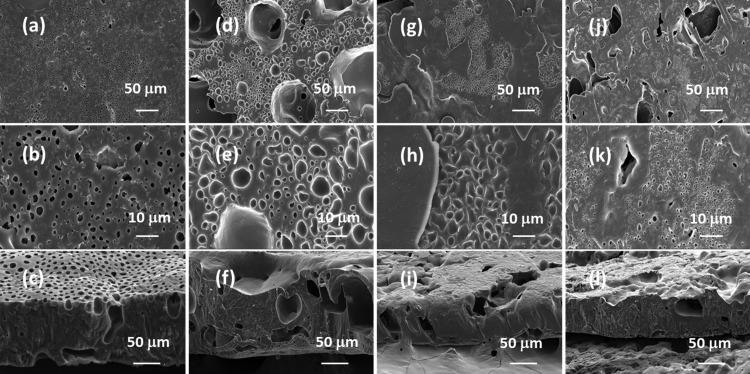
Figure 8.
FE-SEM images of the (a–c) 2%, (d–f) 4%, (g–i) 6%, and (j–l) 8% lipase-embedded PCL films after subjecting to 6 days of enzymatic degradation. Top row ((a), (d), (g), and (j)), middle row ((b), (e), (h), and (k)), and bottom row ((c), (f), (i), and (l)) images correspond to the respective low and high magnifications of the surface and cross-section of the PCL film sections.

