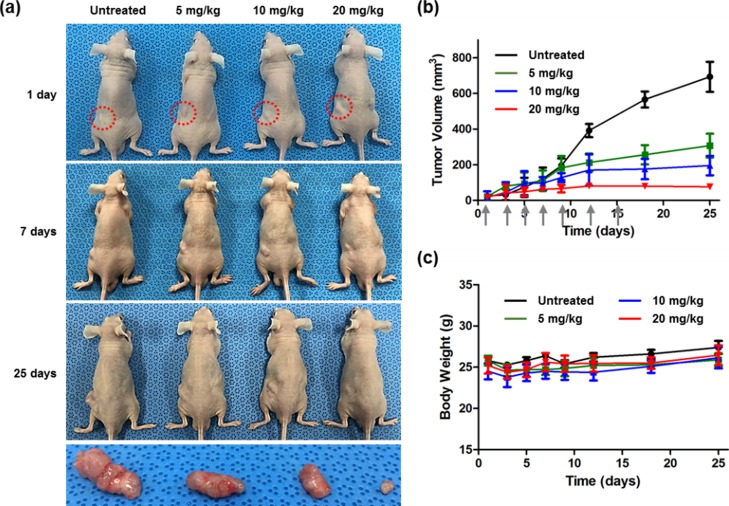
Figure 7.
Therapeutic anticancer activity of B2C. (a) Photographs of tumor-bearing mice treated with various doses of B2C and representative tumor images excised after 25 days. Red dotted lines indicate inoculation sites of SW620 cells. (b) Changes in tumor volumes. Arrows indicate the date of B2C injection. (c) Body weight changes of tumor-bearing mice during the B2C treatment. Values are mean ± SD (n = 4).

