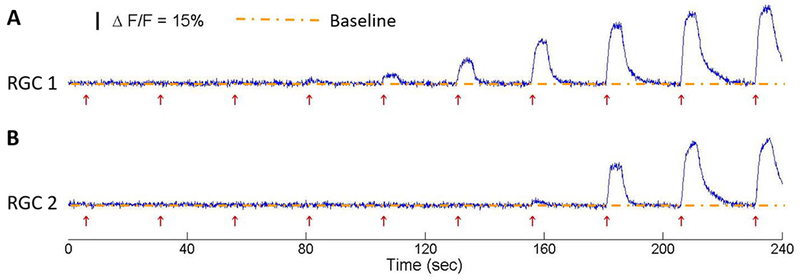
Figure 6:

Normalized changes in fluorescence (ΔF/F) for two RGCs expressing GCaMP6f in response to the 120 Hz 40-μs duration biphasic symmetric pulse train stimuli with different stimuli amplitudes, from subthreshold to suprathreshold. Each stimulus was sustained for 5 seconds followed by a 20-second inter-stimulus interval, to allow the calcium level to return back to baseline. The red arrows indicate the onset of each stimulation pulse train.
