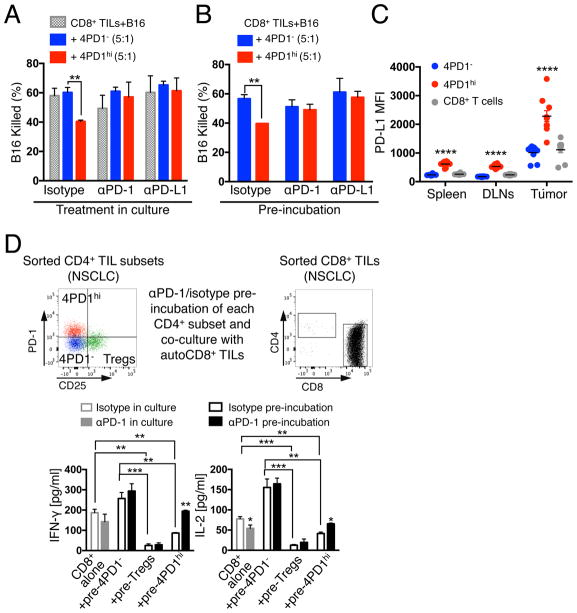
Figure 5. PD-1/PD-L1 blockade counteracts 4PD1hi inhibitory function.
(A,B) 3D killing assays with B16 cells and intra-tumor 4PD1hi or 4PD1− and CD8+ TILs (CD8:CD4=5×10⁴:1×10⁴, suboptimal conditions) FACS-sorted from untreated B16-bearing Foxp3-GFP mice. Mean ± SD percent of killed B16 in co-cultures treated with αPD-1 or αPD-L1 or matched isotype IgGs after 48-hr incubation (n=2–3) (A). Mean ± SD percent of killed B16 in culture with CD8+ TILs and αPD-1- or αPD-L1-pre-treated 4PD1hi or 4PD1− after 48-hr incubation (n=2–3) (B). (C) PD-L1 MFI in 4PD1hi in comparison with 4PD1− and CD8+ T cells from spleen, tumor-draining lymph nodes (DLNs) and tumor in B16-bearing mice (mean ± SEM; n=10). (D) Human NSCLC-derived 4PD1hi, Tregs and 4PD1− were pre-treated with αPD-1 or control isotype IgG and cultured with stimulated autologous (auto) CD8+ TILs at 1:1 ratio for 72 hr. Quantification by Luminex-based bead immunoassay of IFN-γ and IL-2 in CD8+ TIL cultures with αPD-1- or IgG-pre-treated CD4+ T-cell subsets or incubated with αPD-1 or the matched isotype IgG (mean ± SD; n=2 with Tregs and 4PD1hi, n=3 with CD8+ TILs alone; n=4 with IgG-treated 4PD1−; n=6 with αPD-1-treated 4PD1−). Unpaired t test: * = p<0.05, ** = p<0.01, *** = p<0.001, **** = p<0.0001. See also Figure S5.

