
Figure 4:
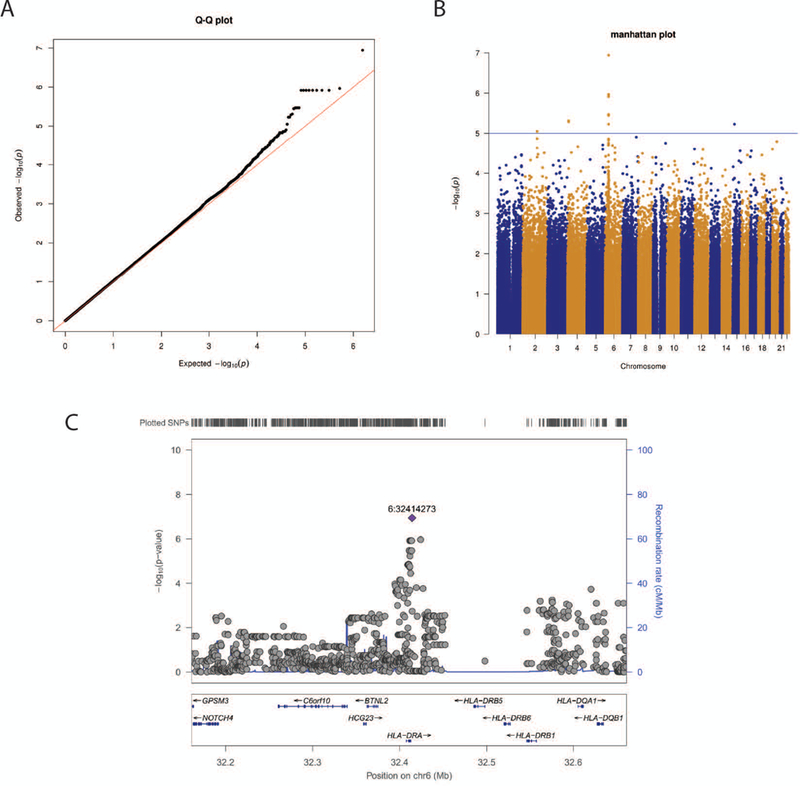
The SNP and insecticide interaction scan using genotyped AMASS data using GEE-joint-gamma method. (a) QQ plot of p-values from the joint test. (b) the Manhattan plot of p-values across autosomes, where the suggestive significance line is drawn at p value of 10−5. (c) LocusZoom plot of the peak region on chromosome 6 as identified in Manhattan plot. Each SNP is represented by a circle except the lead variant as diamond and labeled as chr:position in hg19.