
Figure 3. mSCs exhibit extensive transcriptional heterogeneity.
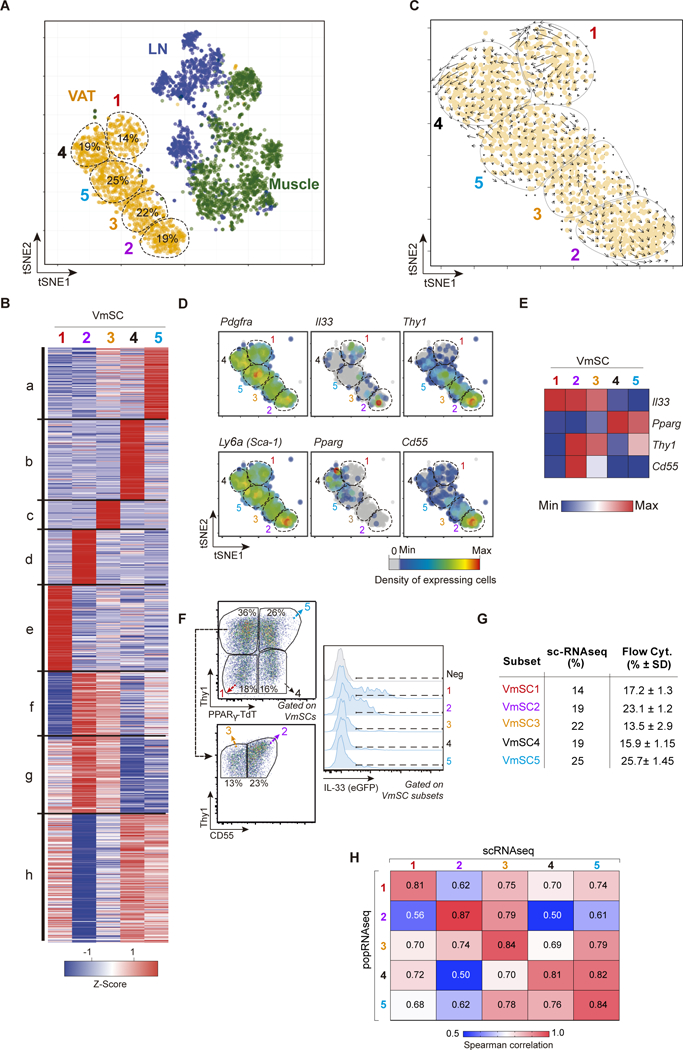
(A) Two-dimensional tSNE plot of scRNA data from VAT (orange), muscle (green) and lymph node (blue) PDGFRα+Sca-1+ mSCs. VmSC subtypes 1–5 were delineated by k- means clustering; their fractional contributions to total VmSCs are indicated. (B) Heat-map showing genes differentially expressed between the VmSC subtypes (FDR < 5%). k-means clustered. (C) VmSCs dynamics (velocity field). The projected next cell state for each single cell is represented by an arrow and projected on the tSNE plot. (D) Same tSNE plot as in panel A overlain with heat-maps of the density of cells expressing various transcript markers. (E) Heat-map of transcript expression within the combined single-cell data of each VmSC subtype. (F-G) Representative dot-plots delineating the VmSC subtypes (left) and indicating their IL-33 expression levels (right) in PpargTdtIl33Egfp double-reporter mice. (G) Comparison of VmSC subtype frequencies obtained by scRNAseq versus flow cytometry. (H) Matrix of Spearman correlation coefficients in head-to-head comparisons of ≥2-fold differentially expressed genes from the scRNAseq and matching population (pop)-level RNAseq datasets. LN, lymph node.