
Fig. 8. Specific ST2 expression on VAT Tregs is involved in their interaction with VmSC subtypes.
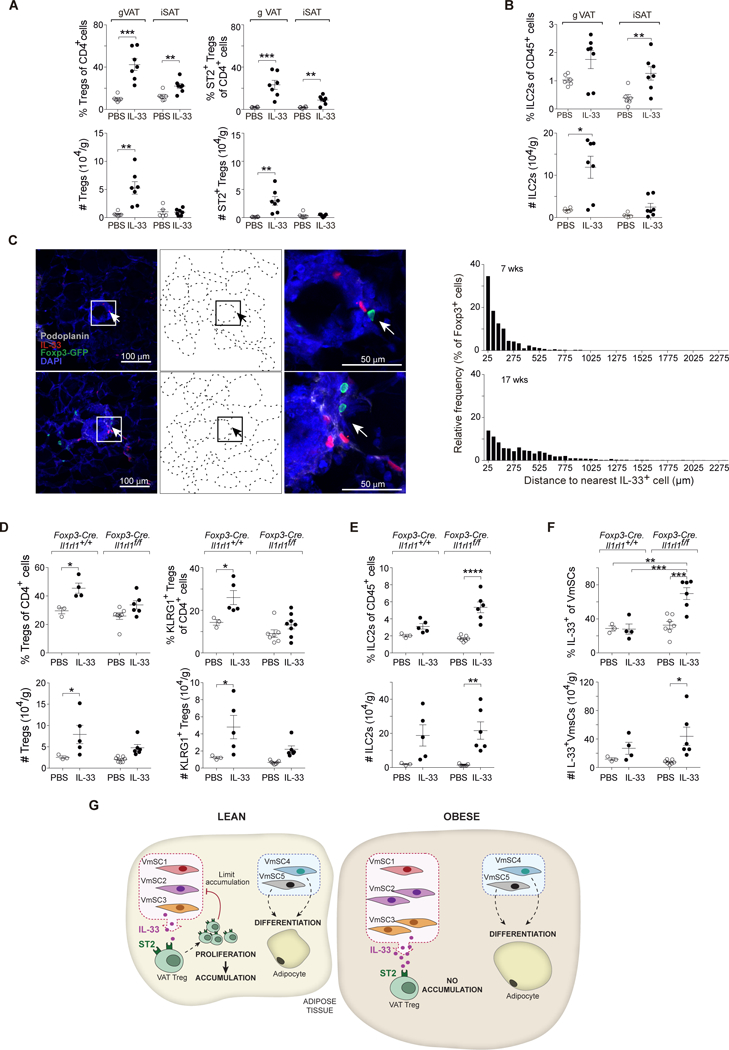
(A and B) IL-33 was administered to wild-type B6 males aged 8–12 weeks. Frequencies (top) and numbers (bottom) of total (left) and ST2+ (right) Tregs (A) or ILC2s (B). (C) Confocal images (group of left panels) showing Tregs and IL-33-expressing cells within eVAT at low-magnification (left), corresponding delineation of adipocyte edges based on autofluorescence of DAPI channel (middle) and high-magnification of the squared indicated area (right). Distance quantification between Foxp3+ Tregs and the nearest IL-33- expressing cell (group of right panels) from whole eVAT tissue sections taken from male VAT-Treg TCR- transgenic mice at 7 (top) and 17 (bottom) weeks of age. Arrows in panel C depict Treg:IL-33+ cell proximity. Color code for Ab staining as indicated within the picture. (D, E and F) IL- 33 was injected into mice lacking ST2 expression specifically by Tregs vs wild-type littermate controls. Frequencies (top) and numbers (bottom) corresponding to total and KLRG1+ Tregs (D), ILC2s (E) and IL-33+ VmSCs (F). All numbers were calculated relative to total tissue weight. (G) Graphic scheme of the proposed VmSC:Treg negative regulatory loop model. All other abbreviations and statistics as per Figs. 1, 5 and 7.