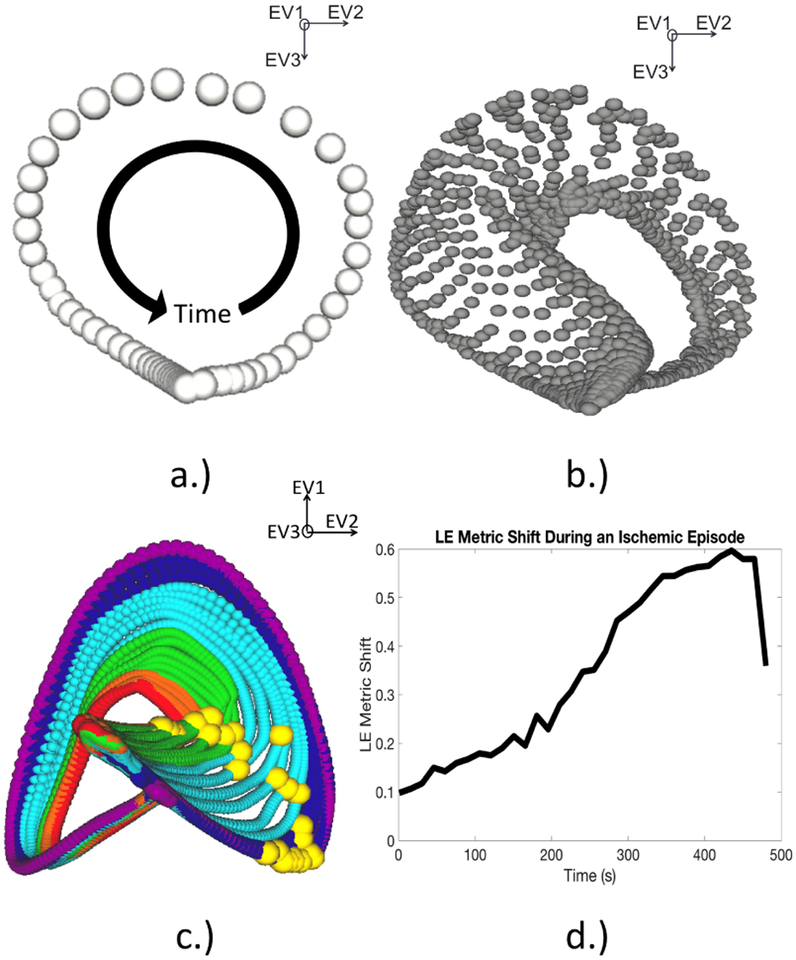
Figure 2.
Learning and utilizing the LE space to create a metric for ischemia. A.) This manifold consists of a single trajectory corresponding to a beat during the rest period, before the induction of ischemia. The progression of the ECG and its relation to the trajectory are shown by the black arrow. B.) This manifold shows several beats mapped into the same manifold space. Each trajectory corresponds to a single representative beat during the intervention. C.) This final manifold shows the previous trajectories now color coded using the same scheme in Figure 1. The yellow spheres represent the instants chosen from each trajectory. D.) This is a plot tracking the euclidean distance between each yellow sphere.

