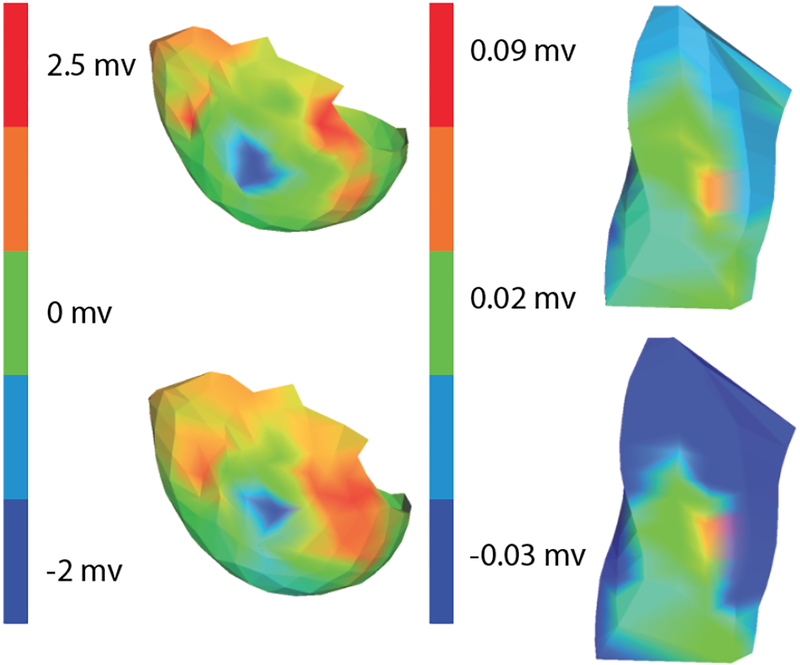
Figure 2.
Regions of ischemia detected on the epicardial surface and the torso surface. Again, color indicates amplitude of the local ST%40 values Row 1: Epicardial and Torso measurements from a Bruce Protocol. Row 2: Epicardial and Torso Measurements from a dobutamine protocol. Results are from the same cases as in Figure 1

