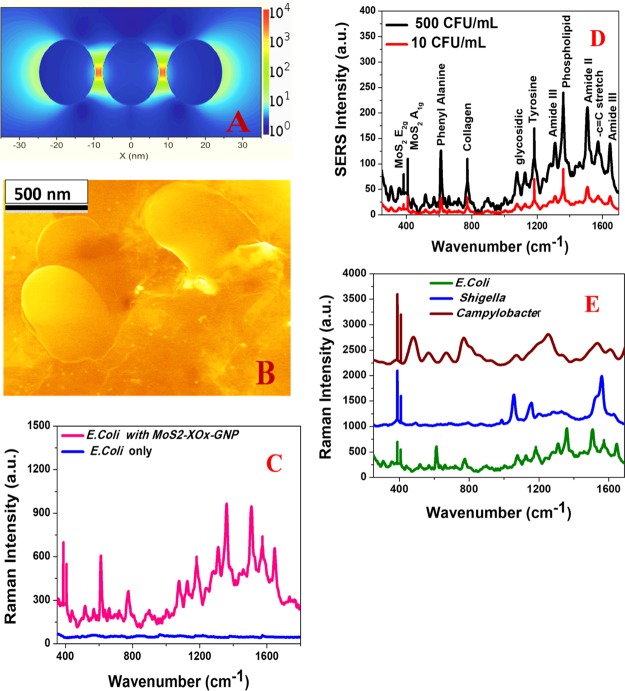
Figure 4.
(A) 3D FDTD simulated electric field enhancement square (|E|2) profiles for GNP assembly containing three nanoparticles. (B) SEM image shows that the drug-resistant Campylobacter bacteria are on the surface of 3D MoS2–xOx–GNP. (C) Raman spectrum shows a huge signal from drug-resistant E. coli (3000 cfu/mL) on 3D MoS2–xOx–GNP, whereas we have not observed any Raman signal from drug-resistant E. coli (3000 cfu/mL) in the absence of 3D MoS2–xOx–GNP surface. (D) Plot shows Raman spectrum from drug resistant E. coli at different concentrations on 3D MoS2–xOx–GNP. (E) Raman spectrum shows that 3D MoS2–xOx–GNP-based Raman can be used as a fingerprint for different bacteria such as E. coli, Shigella, and Campylobacter.

