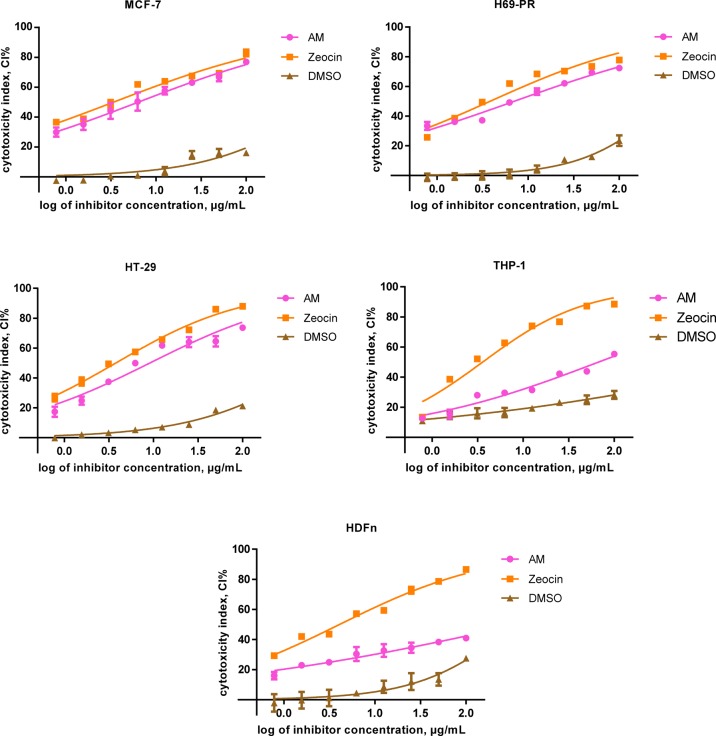
Figure 4.
Cytotoxic activities of AM, Zeocin, and DMSO on the cytotoxicity index (CI%) of immortalized cell lines (dose–response curves with data points as mean ± SEM). GraphPad Prism 7.01 (GraphPad Software, Inc., USA) was employed for extra sum-of-squares F test calculations to (A) appraise the implication of the best-fit-parameter (half maximal inhibitory concentration) between selected trials and to (B) assess the variances amid the dose–response curve fits. MCF-7 F (Dfn, DFd) = (A) F (2, 48) = 3192, p < 0.0001 and (B) F (2, 21) = 34.37, p < 0.0001; H69PR (A) F (2, 48) = 5205, p < 0.0001and (B) F (2, 21) = 29.45, p < 0.0001; HT-29 (A) F (2, 46) = 4892, p < 0.0001 and (B) F (2, 21) = 18.81, p < 0.0001; THP-1 (A) F (2, 48) = 3511, p < 0.0001 and (B) F (2, 21) = 12.41, p = 0.0003; HDFn (A) F (2, 48) = 1577, p < 0.0001 and (B) F (2, 21) = 27.70, p < 0.0001.

